Quantitative Easing and Tightening Explained: How QE and QT Work
Quantitative easing (QE) is a central bank buying large amounts of government and mortgage bonds with newly created bank reserves, to push long-term interest rates down when its policy rate cannot fall further. The Fed's own term is large-scale asset purchases. Quantitative tightening (QT) is the reverse: the holdings are allowed to shrink. This guide explains how both work, what the Federal Reserve did from 2008 to October 2026, how other central banks compare, and what Fed research can and cannot show about yields, inflation and stocks.
Key takeaways
- QE swaps bonds for bank reserves. It does not send money to households, and it is not a rate cut: it works mainly by lowering the extra yield investors demand for holding long bonds, called the term premium.
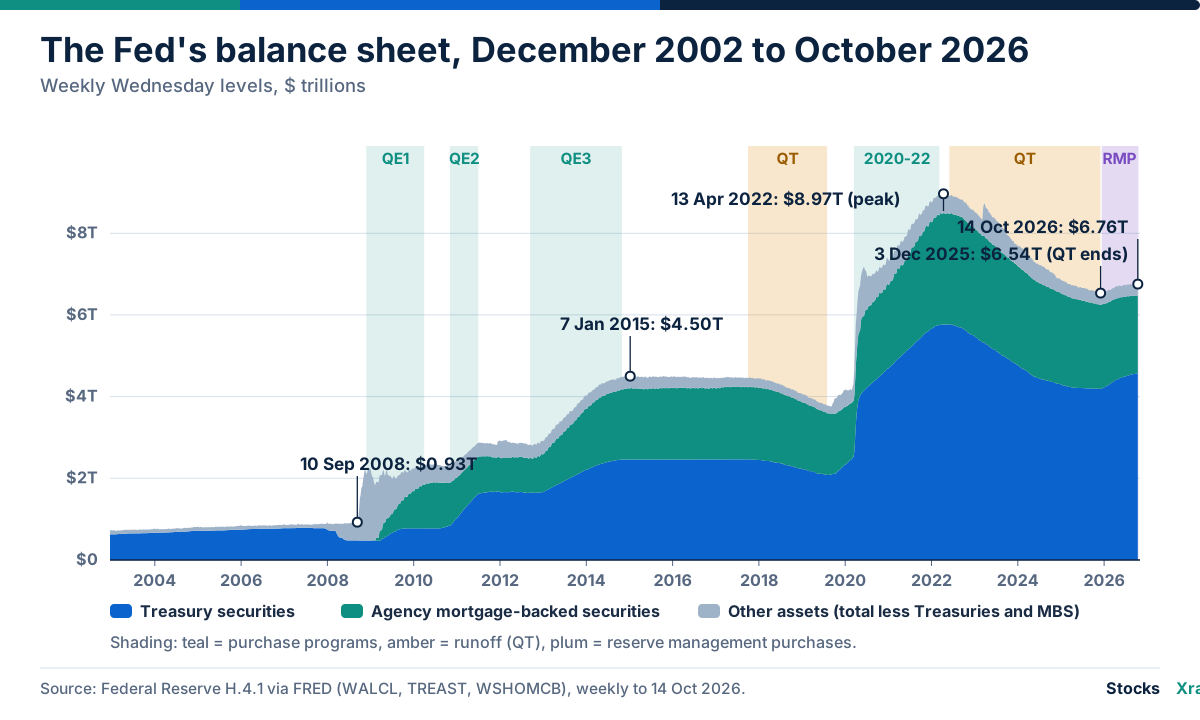
- The Fed's balance sheet grew from $0.93 trillion on 10 September 2008 to a peak of $8.97 trillion on 13 April 2022. QT then cut it to $6.54 trillion by 3 December 2025. On 14 October 2026 it stood at $6.76 trillion.
- QT ended on 1 December 2025. Since 12 December 2025 the Fed has made reserve management purchases of Treasury bills to keep reserves ample: $40 billion a month at first, none in the schedule for 15 October to 13 November 2026. That is not QE.
- Studies published by the Fed and the New York Fed put the effect of the first round (2008 to 2010) at roughly 30 to 100 basis points off the 10-year term premium. Effects on inflation and stocks are harder to isolate.
- Critics point to exit and communication problems, reliance on one very large buyer, and losses: the Fed's net income has been negative since September 2022, leaving a deferred asset of about $233 billion on 14 October 2026.
Why a central bank buys assets when its policy rate is near zero
In normal times a central bank steers the economy with a short-term policy rate, as described in interest rates, the Federal Reserve and stock prices. That rate cannot fall far below zero. On 16 December 2008 the Federal Open Market Committee (FOMC) cut its federal funds target to 0 to 1/4 percent and said policy would now focus on keeping the balance sheet large. On 15 March 2020 it cut to the same range and announced purchases of at least $500 billion of Treasuries and $200 billion of mortgage-backed securities (MBS).
Mortgage rates and corporate bond yields tend to follow longer-term yields, not the overnight rate. A long-term yield is roughly the average short rate investors expect over the bond's life plus a term premium, the extra return required for the risk of holding a long bond (see why bond prices fall when yields rise and how bonds work). With the short rate stuck near zero, buying long bonds pushes down the second part.
Purchases have two other uses. In stressed markets they can restore trading: the Fed's November 2008 program targeted mortgage bonds after spreads on housing debt widened, and March 2020 buying began when Treasury and mortgage markets stopped working smoothly. And since December 2025 the Fed has bought bills to keep reserves at a level that lets it control short-term rates.
How QE works
Bonds for reserves, step by step
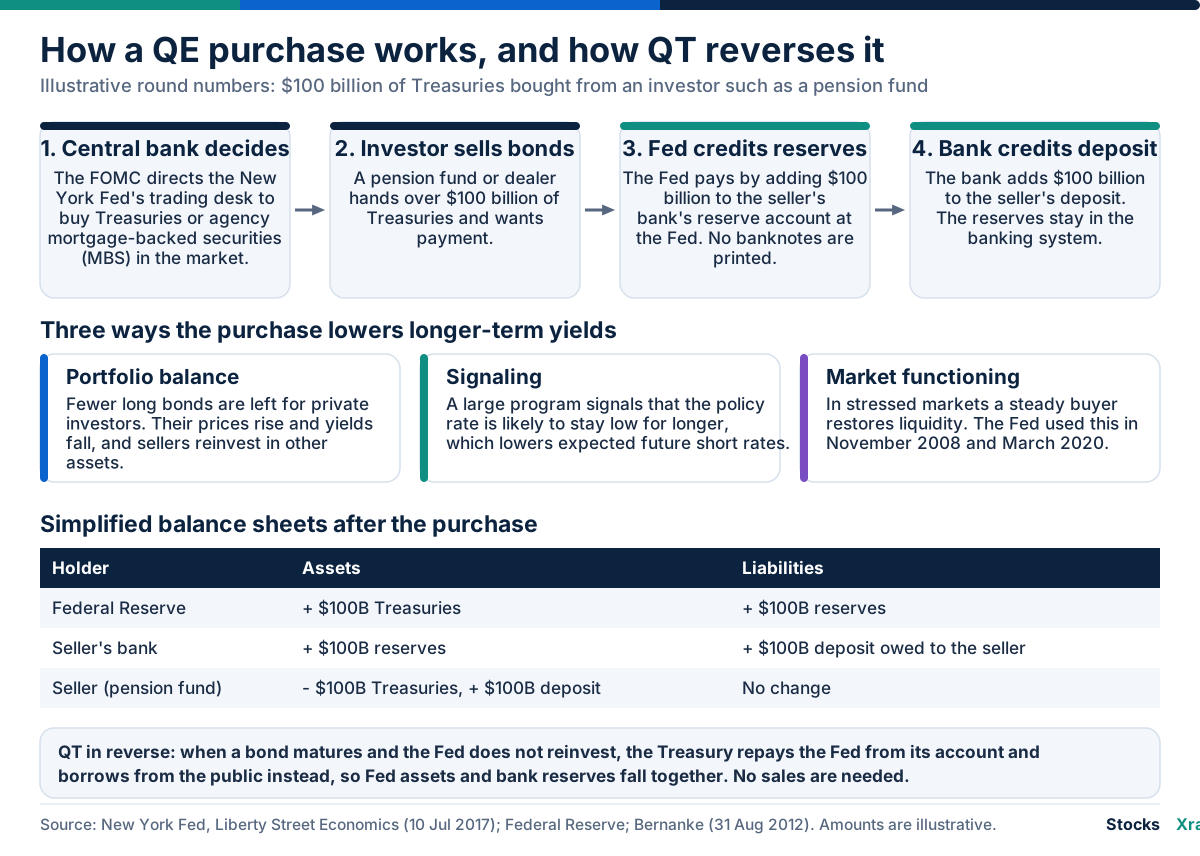
The trading desk at the Federal Reserve Bank of New York carries out the FOMC's instructions by buying securities in the open market. It pays with reserves: electronic balances that banks hold in accounts at the Fed. Reserves are a liability of the Fed and an asset of the bank, so for each dollar of securities bought the Fed's assets and liabilities both rise by a dollar. The Fed, not the banks, decides how many reserves exist in total.
If the seller is not a bank, for example a pension fund, it cannot hold reserves. Its bank receives them and credits the seller's deposit. Fed staff research cited in the New York Fed's explanation found that most of the assets bought in the large programs came from nonbanks.
| Holder | Assets | Liabilities |
|---|---|---|
| Federal Reserve | + $100B Treasuries | + $100B reserves |
| Seller's bank | + $100B reserves | + $100B deposit owed to the seller |
| Seller (a pension fund) | - $100B Treasuries, + $100B deposit | No change |
Illustrative round numbers for a $100 billion purchase, simplified from the New York Fed's explanation (Liberty Street Economics, 10 July 2017).
The balance sheet is bigger than reserves
Reserves are one of several liabilities. The table shows the Fed's balance sheet on 14 October 2026, from the weekly H.4.1 release of 15 October.
| Selected items, 14 October 2026 | $ trillions |
|---|---|
| Assets: US Treasury securities | 4.57 |
| Assets: agency mortgage-backed securities | 1.90 |
| Total assets (including other items) | 6.76 |
| Liabilities: currency in circulation | 2.49 |
| Liabilities: reserve balances | 3.02 |
| Liabilities: Treasury General Account | 0.88 |
| Liabilities: reverse repurchase agreements | 0.33 |
Source: Federal Reserve H.4.1 via FRED (WALCL, TREAST, WSHOMCB, WCURCIR, WRESBAL, WTREGEN, WLRRAL), Wednesday levels. Items do not sum to the total.
Before the 2008 crisis total assets were about $0.9 trillion and reserves about $9 billion (10 September 2008). The Fed says its balance sheet's long-run size follows the public's demand for its liabilities, such as currency and reserves, so a bigger balance sheet is not automatically more stimulus. Today it steers the policy rate with administered rates, not by rationing reserves: from 17 September 2026 it pays 3.90 percent on reserves and 3.75 percent on overnight reverse repos. The Fed calls this an ample-reserves framework, in which the policy rate is only modestly sensitive to small changes in reserve supply.
Why yields fall: the channels
- Portfolio balance. Investors do not treat all assets as perfect substitutes. Fed purchases remove bonds from private portfolios, raising their prices and lowering yields, and sellers then buy other assets, so the effect spreads. Former Fed Chair Ben Bernanke laid out this channel in his August 2012 Jackson Hole speech.
- Signaling. A large program signals that policy will stay easy for longer, which lowers expected future short rates.
- Market functioning. In March 2020 the 10-year Treasury yield hit what was then a record low on 9 March, then rose 65 basis points in nine days as investors sold even Treasuries, and liquidity fell to its worst since 2007 to 2009 (New York Fed staff). A basis point (bp) is one hundredth of a percentage point.
- Bank lending. Fed staff reviews cite studies finding that reserve creation under QE increased bank lending and risk-taking.
Expectations matter as much as purchases: markets price in a program when it is announced, so the effect depends on the expected size and duration of the balance sheet.
A rule of thumb from Fed staff
A June 2022 Fed staff note built balance sheet effects into the Board's FRB/US model. In it, a permanent change in Fed holdings of 10-year-equivalent Treasuries equal to 1% of nominal GDP moves the 10-year term premium by about 10 bp, all else equal. The note frames this around reductions in holdings.
Worked example (illustrative arithmetic, not a forecast): US nominal GDP was about $32.6 trillion at an annual rate in the second quarter of 2026 (BEA, via FRED), so 1% is about $326 billion, and by the rule a change of that size moves the term premium about 10 bp. The same note estimated that shrinking the balance sheet by about $2.5 trillion, instead of holding it at its 2022 peak, was roughly equivalent to raising the policy rate a little more than 50 bp on a sustained basis, and called that highly uncertain.
The US record: rounds, Twist, taper and QT
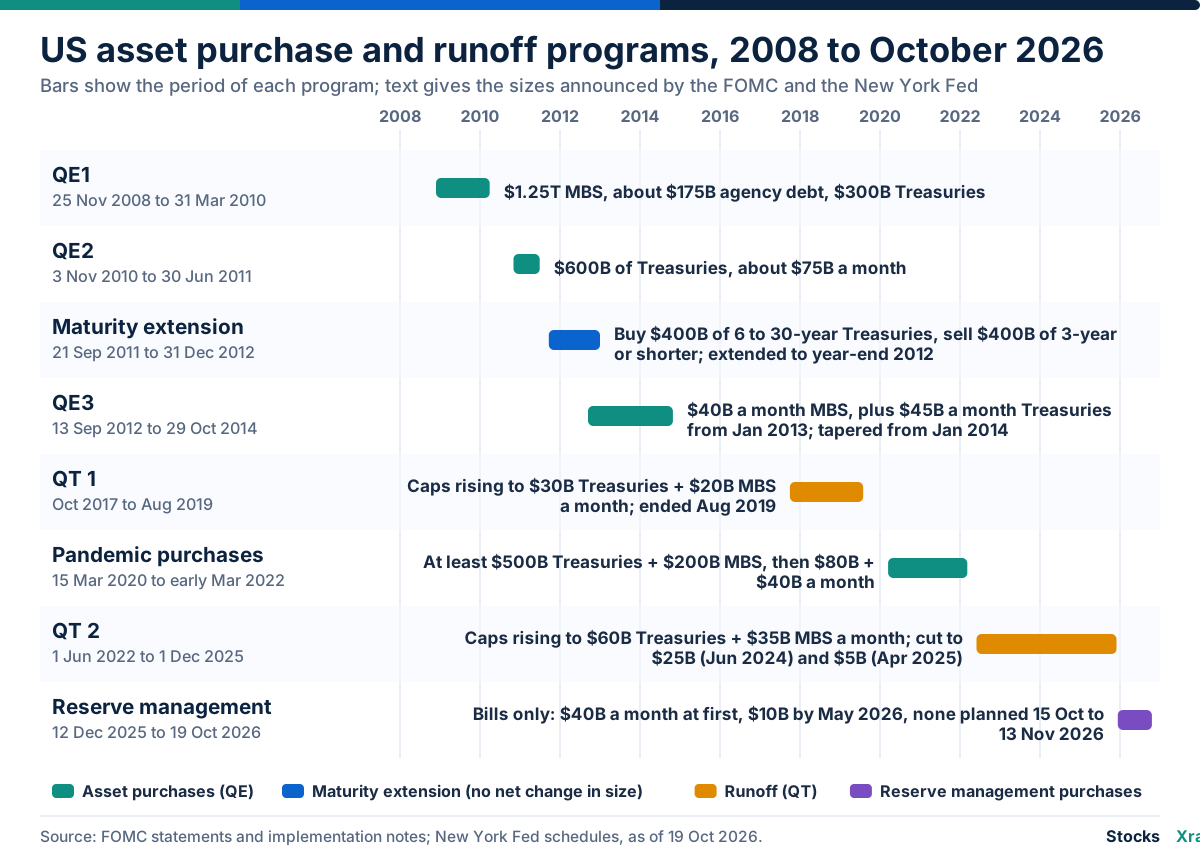
The table gives dates and sizes from FOMC and New York Fed statements. "Pandemic purchases" is our label for the 2020 to 2022 program, which the Fed did not number.
| Program | Dates | What the FOMC announced |
|---|---|---|
| QE1 | 25 Nov 2008 to 31 Mar 2010 | Up to $100B of agency debt and $500B of MBS (Nov 2008); raised on 18 Mar 2009 to up to $1.25T of MBS, up to $200B of agency debt and $300B of Treasuries. Final: $1.25T MBS, about $175B agency debt, $300B Treasuries |
| QE2 | 3 Nov 2010 to 30 Jun 2011 | $600B of longer-term Treasuries, about $75B a month |
| Maturity extension ("Operation Twist") | 21 Sep 2011 to 31 Dec 2012 | Buy $400B of Treasuries with 6 to 30 years left, sell $400B with 3 years or less; extended on 20 Jun 2012 to the end of 2012 |
| QE3 | 13 Sep 2012 to 29 Oct 2014 | $40B a month of MBS, open-ended; $45B a month of Treasuries added from Jan 2013; cut to $35B and $40B from Jan 2014; ended Oct 2014 |
| QT 1 | Oct 2017 to Aug 2019 | Reinvestment caps rising to $30B of Treasuries and $20B of MBS a month; slowed May 2019; ended Aug 2019 |
| Pandemic purchases | 15 Mar 2020 to early Mar 2022 | At least $500B of Treasuries and $200B of MBS, then "amounts needed"; at least $80B and $40B a month from mid-2020; tapered Nov 2021 to Mar 2022 |
| QT 2 | 1 Jun 2022 to 1 Dec 2025 | Caps rising to $60B of Treasuries and $35B of MBS a month; cut to $25B (Jun 2024) and $5B (Apr 2025); ended 1 Dec 2025 |
| Reserve management purchases | 12 Dec 2025 onward | Treasury bills: about $40B a month at first, $10B by May 2026, none planned for 15 Oct to 13 Nov 2026 |
QE1 to QE3, 2008 to 2014
QE1 began as an attempt to repair housing credit. The FOMC said in November 2009 that it would buy $1.25 trillion of MBS and about $175 billion of agency debt, a little under the $200 billion maximum because of limited supply. With $300 billion of Treasuries the total was $1.725 trillion, roughly 12 percent of 2009 GDP by New York Fed economists' estimate. The 2011 maturity extension program did not enlarge the balance sheet: it swapped short-dated Treasuries for long-dated ones.
QE3 had no fixed total. The FOMC said it would continue until the labor market outlook improved substantially, tapered from January 2014 and ended the program in October 2014. The balance sheet was $4.50 trillion on 7 January 2015. The first rate increase came on 16 December 2015, and the Fed kept reinvesting maturing bonds until QT began in 2017.
March 2020 and after
New York Fed staff report that the March 2020 purchases peaked above $100 billion a day and totaled over $2 trillion between 13 March and 30 April. On 23 March the FOMC dropped fixed totals and said it would buy in the amounts needed to support smooth market functioning. The staff note that this program was driven first by market functioning, while earlier rounds mainly aimed to lower rates.
By June 2020 the pace was about $80 billion of Treasuries and $40 billion of MBS a month, and in December 2020 the Fed pledged to continue at least that pace until substantial further progress toward its goals. It began tapering on 3 November 2021, doubled the pace of reductions on 15 December and ended net purchases in early March 2022. A Fed staff note puts the growth in the balance sheet over the program at roughly $4.8 trillion, about 20 percent of annual GDP.
QT: how runoff works and why the Fed stopped
How runoff works
QT is mostly not a sale program. The FOMC's 2014, 2017 and 2022 plans reduce holdings "primarily" by reinvesting only the part of maturing principal that exceeds a monthly cap, so the portfolio shrinks as bonds mature. The 2014 principles said the Fed did not expect to sell mortgage bonds. When a Treasury bond matures, the Treasury repays the Fed from its account and borrows from investors to replace the money, so, all else equal, the Fed's assets and bank reserves fall by the same amount.
| Announced | Treasury cap per month | Agency debt and MBS cap per month |
|---|---|---|
| 14 Jun 2017 (started Oct 2017) | $6B, rising $6B every 3 months to $30B | $4B, rising $4B every 3 months to $20B |
| 20 Mar 2019 | Cut from $30B to $15B from May 2019; end in Sep 2019 | Unchanged until Sep 2019 |
| 31 Jul 2019 | Runoff to end in August, two months early | Ended |
| 4 May 2022 (started 1 Jun 2022) | $30B, then $60B after 3 months | $17.5B, then $35B after 3 months |
| 1 May 2024 | Cut from $60B to $25B from June | Unchanged at $35B |
| 19 Mar 2025 | Cut from $25B to $5B from April | Unchanged at $35B |
| 29 Oct 2025 | Runoff to end on 1 Dec 2025 | Ended |
Between the April 2022 peak and 3 December 2025 the balance sheet fell from $8.97 trillion to $6.54 trillion, about $2.4 trillion. The March 2025 slowdown drew one dissent, from Governor Christopher Waller, who preferred to keep the earlier pace.
Why the Fed stopped in December 2025
The 2022 plan said runoff would slow and then stop when reserves were "somewhat above" the ample level. For most of the period reserves barely moved, because money draining from the overnight reverse repo facility absorbed the runoff. Once that facility was nearly empty, Chair Jerome Powell said in October 2025, further runoff would cut reserves more directly. New York Fed staff add that the Treasury rebuilt its account at the Fed after the debt limit was raised in July 2025, and that repo rates firmed and spiked on some days.
On 29 October 2025 the FOMC decided to end the reduction on 1 December. On 10 December it judged that reserves had declined to ample levels and said it would buy shorter-term Treasuries as needed, starting with about $40 billion of bills from 12 December. The New York Fed said the early pace was meant to get ahead of an expected April drain on reserves from tax payments.
September 2019 was the precedent. On 17 September an overnight repo rate rose above 5 percent and the federal funds rate printed above its target range, after tax payments and Treasury settlements cut reserves by about $120 billion in two business days (Fed staff note). QT had ended in August, and from 15 October the New York Fed bought bills at about $60 billion a month.
Where things stand, as of 19 October 2026
The Fed is running neither QE nor QT. It holds $4.57 trillion of Treasuries and $1.90 trillion of MBS and reinvests MBS principal, $13 billion to $18 billion a month in 2026 schedules, into bills. Reserve management purchases ran at $40 billion a month from 12 December 2025 to 13 April 2026, $25 billion to 13 May, $10 billion a month to 13 August, and none since. The New York Fed says amounts are not on a preset course.
On 16 September 2026 the FOMC raised the target range by 1/4 point to 3-3/4 to 4 percent and said it was maintaining ample reserves. Our rates page shows the US policy rate at 3.88%, and the US Treasury yields page shows the 10-year at 5.09%, the 2-year at 4.74% and the 30-year at 5.43%, a 10-year minus 2-year gap of +0.35 pt (see the yield curve and recession signals). The July report says a new Fed task force will examine the ample-reserves regime and the balance sheet's composition. As of 19 October the next FOMC meeting is 27 to 28 October 2026.
How other central banks compare
Other large central banks used the same tool at different times and unwound it differently. Amounts are in local currency; to convert them use the yen to dollar, euro to dollar and pound to dollar converters.
| Central bank | Large-scale purchases began | Scale, from the bank | Unwinding, as of October 2026 |
|---|---|---|---|
| Bank of Japan | 4 Apr 2013 (quantitative and qualitative easing) | Government bond holdings to rise about ¥50T a year | Ended its yield-curve and negative-rate framework on 19 Mar 2024 and kept buying at about the same amount. Plan of 16 Jun 2026: about ¥2.7T a month in Apr to Jun 2026, falling about ¥200B a quarter to ¥2.1T in Jan to Mar 2027, then about ¥2T a month from Apr 2027 |
| European Central Bank | Net purchases from Oct 2014, €60B a month from Mar 2015; pandemic program Mar 2020 | Pandemic program envelope €1,850B | Net purchases ended Jul 2022 (APP) and Mar 2022 (PEPP); reinvestment ended Jul 2023 (APP) and Dec 2024 (PEPP). Holdings fall as bonds mature; APP holdings were about €2.06T in Sep 2026 |
| Bank of England | Mar 2009 | £895B of bonds in total: £875B gilts, £20B corporate bonds; last increase announced Nov 2020 | QT began Feb 2022. On 16 Sep 2026 the MPC voted unanimously to reduce the stock held for monetary policy to zero in a multi-year plan averaging £46B a year to end-2034, including £20B of annual sales |
Sources: Bank of Japan, European Central Bank and Bank of England publications listed under Sources.
The main difference in unwinding is that the Bank of England plans active sales alongside maturities, while the Fed's plans and the ECB's asset purchase program rely on letting bonds mature. The Bank of England says its own aim in QT is not to affect interest rates or inflation but to keep QE available if needed later.
What happened afterwards: yields, inflation and stocks
Yields
The strongest evidence concerns long-term yields. An event study published by the New York Fed, covering eight key QE1 announcements between November 2008 and November 2009 found the 10-year Treasury yield fell a cumulative 91 bp, mostly through the term premium. It concluded that the 10-year term premium fell between 30 and 100 bp because of purchases through March 2010. In 2012 Bernanke summarized the research as 40 to 110 bp for the first program, 15 to 45 bp for the second and 80 to 120 bp for all programs together in three studies.
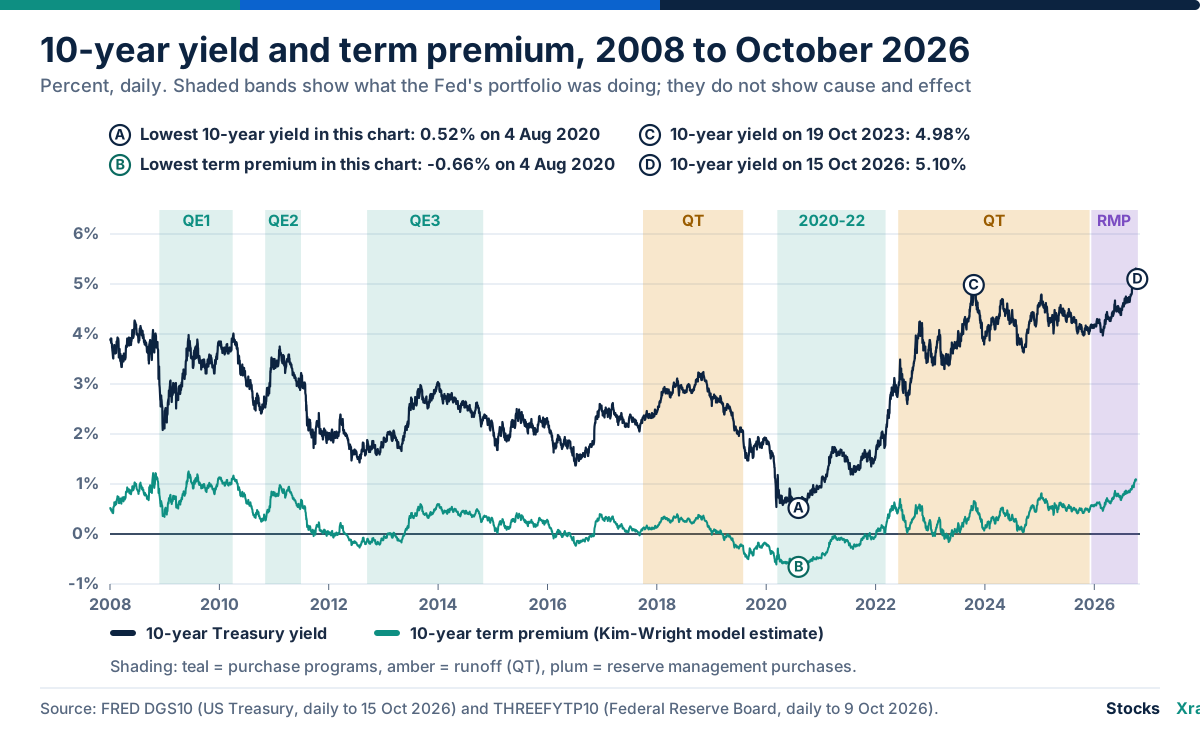
Yields did not simply fall afterwards. On 18 March 2009, when the Fed announced $300 billion of Treasury purchases, the 10-year yield fell from 3.02% to 2.51% (FRED). By 31 March 2010, when QE1 buying finished, it was 3.84%. From 21 May to 5 September 2013, after Fed officials signaled that purchases might slow, it rose from 1.94% to 2.98%, a reaction Fed staff say followed communications largely in line with analysts' expectations. It reached 4.98% on 19 October 2023; a Fed staff note attributed the rise mainly to the term premium, citing QT, heavier Treasury issuance and uncertainty without separating them. On 15 October 2026 it was 5.10%, about ten months after QT ended. The chart's lows for both the yield (0.52%) and the term premium (-0.66%) came on 4 August 2020. A yield reflects expected policy rates, growth, inflation, bond supply and the term premium, and purchases act on only some of those.
Inflation
After QE1 to QE3 inflation did not accelerate. Core PCE inflation, which excludes food and energy, averaged about 1.5% from 2009 to 2019 on a 12-month basis and was at or above 2% in only 5 of those 132 months (BEA data via FRED, our calculation). A 2020 review by Fed Board and Reserve Bank staff concluded that the feared outbreak of inflation did not materialize, and said recent studies point to modestly higher inflation than without QE.
The second episode ended differently. Twelve-month PCE inflation peaked at 7.2% in June 2022 and CPI inflation at about 9%. Whether the 2020 to 2022 purchases contributed is disputed. The FOMC's September 2022 statement cited pandemic-related supply and demand imbalances and higher food and energy prices, and a June 2022 San Francisco Fed analysis attributed about half of the rise above pre-pandemic levels to supply factors and about a third to demand. Powell said in October 2025 that "we could have—and perhaps should have—stopped asset purchases sooner", while adding that this was unlikely to have changed the trajectory fundamentally. He also acknowledged fair questions from outside researchers, including at Brookings and the Hoover Institution, about the size and composition of the purchases. For how inflation reaches company profits see inflation and stocks; the Market Compass shows market-based inflation expectations (how to read it).
Stocks and the dollar
Bernanke argued in 2012 that the purchases appeared to have lifted stock prices, by lowering discount rates and improving the outlook, and called it probably not a coincidence that the lasting recovery began in March 2009, soon after purchases were expanded. He also cautioned that the wider effects are hard to measure because the outcome without the program cannot be observed.
A Federal Reserve Board working paper measured announcement effects with intraday data. A surprise that cut the 10-year yield by 25 bp, with no change in the federal funds rate, raised US stock prices by about 0.7 percentage point, much less than a conventional rate surprise with the same effect on long yields, and easing by the Fed weakened the dollar. A 2020 Fed review reports that stocks respond most several weeks after QE announcements. See the S&P 500 page and US Dollar Index page.
The S&P 500 closed at 3,386.15 on 19 February 2020, 2,237.40 on 23 March 2020 (the day the Fed said it would buy in the amounts needed) and 4,796.56 on 3 January 2022, as purchases were being tapered. It closed at 3,577.03 on 12 October 2022, four months into QT, but the policy rate also rose from 1/4 to 1/2 percent in March 2022 to 3 to 3-1/4 percent in September, so that decline cannot be assigned to QT alone. The chart starts in March 2021.
Why the evidence is hard to read
- No counterfactual. Nobody can observe the economy without the program, so effects are inferred from models or narrow windows around announcements.
- Overlapping tools. Forward guidance, lending facilities and fiscal policy moved alongside purchases. A Fed Board model study estimated that QE and forward guidance combined lowered unemployment by at most 1-1/4 percentage points and added at most 1/2 point to inflation, with the peaks arriving in 2015 and 2016.
- Expectations. Markets move on announcements, so yields can change long before or after bonds are bought, as in 2013.
- Changing conditions. Effects looked larger when markets were stressed, and there is less room to lower long yields when they start very low.
Risks and criticisms
- Exit and communication. The 2013 yield jump and 2019 repo spike show that signals about shrinking the balance sheet, or shrinking it too far, can unsettle markets. Powell said in 2025 that the Fed's pandemic-era choices were informed by December 2018 and the 2013 taper tantrum, and that its current approach is cautious to avoid a repeat of September 2019.
- A dominant buyer. Bernanke warned in 2012 that if the Fed became too large a buyer in some segments, private trading could dry up and liquidity weaken, working against lower yields. He saw few signs of it then.
- Risk-taking. Lower yields can push investors toward riskier assets. The 2020 Fed staff review found some nonproductive risk-taking but concluded that financial-stability problems were smaller than feared.
- Losses. The Fed owns long-term bonds but pays short-term rates on reserves, and St. Louis Fed economists report its costs began to exceed its income in September 2022. The H.4.1 line for earnings remittances due to the Treasury, negative while a deferred asset exists, was -$245.9 billion on 28 January 2026 and -$233.2 billion on 14 October 2026. The Fed says negative income does not affect monetary policy. Remittances exceeded $920 billion between 2011 and 2021 (St. Louis Fed).
- Wealth and inequality. QE raises asset prices, which benefits owners. The Bank of England's own research found that older people gained most from wealth, younger people from jobs and pay, and that most people benefited with no rise in inequality. That is one central bank's view of its own policy.
- Size and composition. Critics question how much was bought and in what form. The Fed says it intends to hold primarily Treasuries in the longer run, to limit effects on how credit is allocated across sectors.
Common mistakes
- "QE is printing money." The Fed does not print banknotes to buy bonds. It creates electronic reserves that only banks and a few other institutions can hold, so the money goes to bank accounts at the Fed, not to households. The effect on the broader money supply depends on who sells and what banks and investors then do.
- "QE means stimulus checks." Pandemic payments of up to $1,200 per adult were sent by the Treasury and the IRS (IRS release IR-2020-61). The Fed's purchases were a separate action.
- "QE is a rate cut and QT is a rate hike." They are separate tools. The Fed announced QE1 on 25 November 2008, three weeks before the funds rate target reached 0 to 1/4 percent, and in September 2026 it raised rates while neither QE nor QT was under way.
- "A bigger balance sheet always means more stimulus." Part of its size reflects currency and the Treasury's account, and reserve management purchases aim at ample reserves, not easing.
- "QT means the Fed is selling bonds." The Fed's runoff relied on maturities and caps, not sales.
Frequently asked questions
What is quantitative easing? A central bank buys large amounts of government and mortgage bonds with newly created reserves, usually when its policy rate is near zero. The aim is to lower longer-term interest rates, mainly by reducing the term premium and signaling that policy will stay easy.
What is the difference between QE and QT? QE adds bonds and reserves to the central bank's balance sheet. QT shrinks both, usually by letting bonds mature without full reinvestment. The Fed's QT cut total assets from $8.97 trillion (April 2022) to $6.54 trillion (December 2025).
Is QE the same as printing money? No. The central bank creates electronic reserves to pay for bonds but does not print banknotes or give cash to households. Reserves sit in bank accounts at the central bank, and the bond sellers end up holding deposits.
Is the Fed doing QE or QT right now? As of 19 October 2026, neither. QT ended on 1 December 2025. The Fed has since bought Treasury bills to keep reserves ample, but its schedule for 15 October to 13 November 2026 has no reserve management purchases.
How big were the Fed's QE programs? QE1 (2008 to 2010) was $1.25 trillion of mortgage bonds, about $175 billion of agency debt and $300 billion of Treasuries; QE2 was $600 billion of Treasuries. QE3 ran at $85 billion a month in 2013. The 2020 to 2022 program grew the balance sheet by about $4.8 trillion.
Does QE cause inflation? After the 2008 programs inflation stayed low (core PCE averaged about 1.5% from 2009 to 2019). After 2020 it rose sharply, but Fed analyses give large roles to supply problems, demand and fiscal support, and economists disagree about the purchases' share.
Does QE push stock prices up? Fed studies find stocks tend to rise around QE announcements, by a modest amount per unit of yield change. Over longer periods earnings, growth and rates dominate, and the S&P 500 fell in 2022 when QT began.
Why did the Fed stop QT in December 2025? The plan was to stop when reserves were somewhat above ample. By late 2025 the overnight reverse repo facility was nearly drained and repo rates were firming, and on 10 December the FOMC judged that reserves had declined to ample levels.
Sources and data notes
- Federal Reserve Board, FOMC statements and implementation notes, 25 Nov 2008 to 16 Sep 2026: https://www.federalreserve.gov/newsevents/pressreleases.htm
- FOMC calendar: https://www.federalreserve.gov/monetarypolicy/fomccalendars.htm
- Federal Reserve H.4.1 weekly balance sheet, 15 Oct 2026: https://www.federalreserve.gov/releases/h41/current/
- FRED data (WALCL, TREAST, WSHOMCB, WRESBAL, WTREGEN, WCURCIR, WLRRAL, RESPPLLOPNWW, DGS10, THREEFYTP10, PCEPILFE, PCEPI, CPIAUCSL, SP500, GDP): https://fred.stlouisfed.org
- New York Fed, Treasury securities operational details: https://www.newyorkfed.org/markets/domestic-market-operations/monetary-policy-implementation/treasury-securities/treasury-securities-operational-details
- New York Fed, Liberty Street Economics, "How the Fed Changes the Size of Its Balance Sheet", 10 Jul 2017: https://libertystreeteconomics.newyorkfed.org/2017/07/how-the-fed-changes-the-size-of-its-balance-sheet/
- New York Fed, Teller Window, "The Implementation of Reserve Management Purchases to Maintain Ample Reserves", 31 Mar 2026: https://tellerwindow.newyorkfed.org/2026/03/31/the-implementation-of-reserve-management-purchases-to-maintain-ample-reserves/
- Gagnon, Raskin, Remache and Sack, "Large-Scale Asset Purchases by the Federal Reserve: Did They Work?", Economic Policy Review, May 2011: https://www.newyorkfed.org/medialibrary/media/research/epr/11v17n1/1105gagn.pdf
- Fleming, Liu, Podjasek and Schurmeier, "The Federal Reserve's Market Functioning Purchases", Staff Report 998, Dec 2021: https://www.newyorkfed.org/medialibrary/media/research/staff_reports/sr998.pdf
- Bernanke, "Monetary Policy since the Onset of the Crisis", 31 Aug 2012: https://www.federalreserve.gov/newsevents/speech/bernanke20120831a.htm
- Powell, "Understanding the Fed's Balance Sheet", 14 Oct 2025: https://www.federalreserve.gov/newsevents/speech/powell20251014a.htm
- FEDS Note, "Substitutability between Balance Sheet Reductions and Policy Rate Hikes", 3 Jun 2022: https://www.federalreserve.gov/econres/notes/feds-notes/substitutability-between-balance-sheet-reductions-and-policy-rate-hikes-some-illustrations-20220603.html
- FEDS Note, "What Happened in Money Markets in September 2019?", 27 Feb 2020: https://www.federalreserve.gov/econres/notes/feds-notes/what-Happened-in-Money-Markets-in-September-2019-20200227.htm
- FEDS Notes on the 2013 taper tantrum (4 Oct 2023) and the 2023 Treasury yield rise (3 Sep 2024): https://www.federalreserve.gov/econres/notes/feds-notes/u-s-interest-rates-and-emerging-market-currencies-taking-stock-10-years-after-the-taper-tantrum-20231004.html and https://www.federalreserve.gov/econres/notes/feds-notes/the-treasury-tantrum-of-2023-20240903.html
- Carlson et al., "Issues in the Use of the Balance Sheet Tool", FEDS 2020-071: https://www.federalreserve.gov/econres/feds/files/2020071pap.pdf
- Engen, Laubach and Reifschneider, FEDS 2015-005: https://www.federalreserve.gov/econresdata/feds/2015/files/2015005pap.pdf
- Rogers, Scotti and Wright, IFDP 1101 (Mar 2014): https://www.federalreserve.gov/pubs/ifdp/2014/1101/ifdp1101.pdf
- Federal Reserve, Monetary Policy Report, July 2026: https://www.federalreserve.gov/monetarypolicy/2026-07-mpr-part2.htm
- Federal Reserve FAQ on balance sheet size: https://www.federalreserve.gov/faqs/money_12852.htm
- San Francisco Fed, Economic Letter 2022-15: https://www.frbsf.org/economic-research/publications/economic-letter/2022/june/how-much-do-supply-and-demand-drive-inflation/
- St. Louis Fed, "The Fed's Remittances to the Treasury: Explaining the Deferred Asset", Nov 2023: https://www.stlouisfed.org/on-the-economy/2023/nov/fed-remittances-treasury-explaining-deferred-asset
- IRS release IR-2020-61: https://www.irs.gov/newsroom/economic-impact-payments-what-you-need-to-know
- Bank of Japan statements of 4 Apr 2013, 19 Mar 2024 and 16 Jun 2026: https://www.boj.or.jp/en/mopo/mpmdeci/mpr_2026/k260616b.pdf
- European Central Bank, asset purchase and pandemic purchase program pages: https://www.ecb.europa.eu/mopo/implement/app/html/index.en.html and https://www.ecb.europa.eu/mopo/implement/pepp/html/index.en.html
- Bank of England, quantitative easing page and September 2026 Monetary Policy Summary: https://www.bankofengland.co.uk/monetary-policy/quantitative-easing and https://www.bankofengland.co.uk/monetary-policy-summary-and-minutes/2026/september-2026
- Coverage: US data to 14 October 2026 (balance sheet), 15 October 2026 (yields) and 9 October 2026 (term premium); live figures come from site tokens. Not covered: central banks other than the Fed, Bank of Japan, ECB and Bank of England, and emergency lending facilities.
Educational information, not financial advice.
Related reading
Educational only, not financial advice. Examples use illustrative numbers.