How to Read the COT Report: Commercials, Speculators and Net Positions

The COT report is a weekly publication from the US Commodity Futures Trading Commission (CFTC) that shows how large traders are positioned in US futures markets. It comes out on Fridays at 3:30 p.m. Eastern and describes positions as of the previous Tuesday. This guide explains what the report covers, who the commercial, non-commercial and managed money groups are, how to calculate a net position, what positioning extremes can and cannot show, and where the data misleads.
Key takeaways
- A weekly snapshot that is already three days old. The Commitments of Traders (COT) report is released on Fridays at 3:30 p.m. Eastern for positions at the close on the previous Tuesday. Holidays can push the release back, in 2026 to the following Monday.
- Group labels describe business type, not skill or intent. "Commercial" means a trader that uses futures to hedge business risk, and "managed money" means funds. The CFTC cannot tell whether a given position is a hedge or a bet.
- The report type changes the answer. Legacy, Disaggregated and Traders in Financial Futures (TFF) split the same market differently. In yen futures on October 13, 2026, the Legacy non-commercial group was net long while TFF leveraged funds were net short.
- Net position is long minus short. It is easiest to compare as a share of open interest and against its own history, and the nets of all groups in a market sum to zero.
- Extremes show crowding, not timing. Research mostly finds that positions move with or after prices, and two real episodes below show crowded positions lasting for months before a reversal.
What the COT report is and who publishes it
The Commitments of Traders report is published by the CFTC, the US regulator of futures and options on futures. For each market it lists how many contracts different groups of traders hold long and short at the close on a Tuesday. A market appears when at least 20 traders hold positions at or above the CFTC's reporting level.
The data come from clearing members, futures commission merchants and foreign brokers, which file daily position reports for large traders. If a trader reaches the reporting level in any single contract month, the firm reports that trader's whole position in the commodity across all months. The CFTC says these reportable positions usually make up 70 to 90 percent of total open interest, and the rest is shown as non-reportable. In the CFTC's rules the reporting level is 200 contracts for gold and 350 for crude oil, though the CFTC adjusts levels by market.
Monthly publication began in 1962 for 13 agricultural commodities, reports became free online in 1995, weekly publication began in 2000, and the Disaggregated (2009) and TFF (2010) versions added detail. The CFTC says it does not analyze the data or make recommendations from it.
What the report does not show
- Trades. It is a snapshot of open positions at one close, not a record of volume. A trader can buy and sell within the week and leave no trace.
- Named traders. Individual positions and classifications are confidential, and the number of traders in the small non-reportable group is unknown.
- Swaps and other over-the-counter deals. Only futures and options on futures are covered, so a bank's swap book appears only through the futures it uses to hedge it.
- Every exchange. Some venues publish their own reports. ICE Futures Europe, for example, issues weekly reports for Brent crude and other contracts, modeled on the CFTC Disaggregated format (Tuesday positions, Friday release at 18:30 London time, per its April 2025 notes).
- Shareholders. Futures on the S&P 500 appear in the report, but who owns the underlying shares does not.
If futures contracts are unfamiliar, futures contracts basics covers who uses them and how they work.
When the COT report is released, and why the data is three days old
The CFTC normally publishes the report on Friday at 3:30 p.m. Eastern, using positions from the close on the Tuesday of the same week. Reporting firms send their data on Wednesday morning, and the CFTC corrects and verifies it before Friday afternoon. The agency describes this as three days of processing.
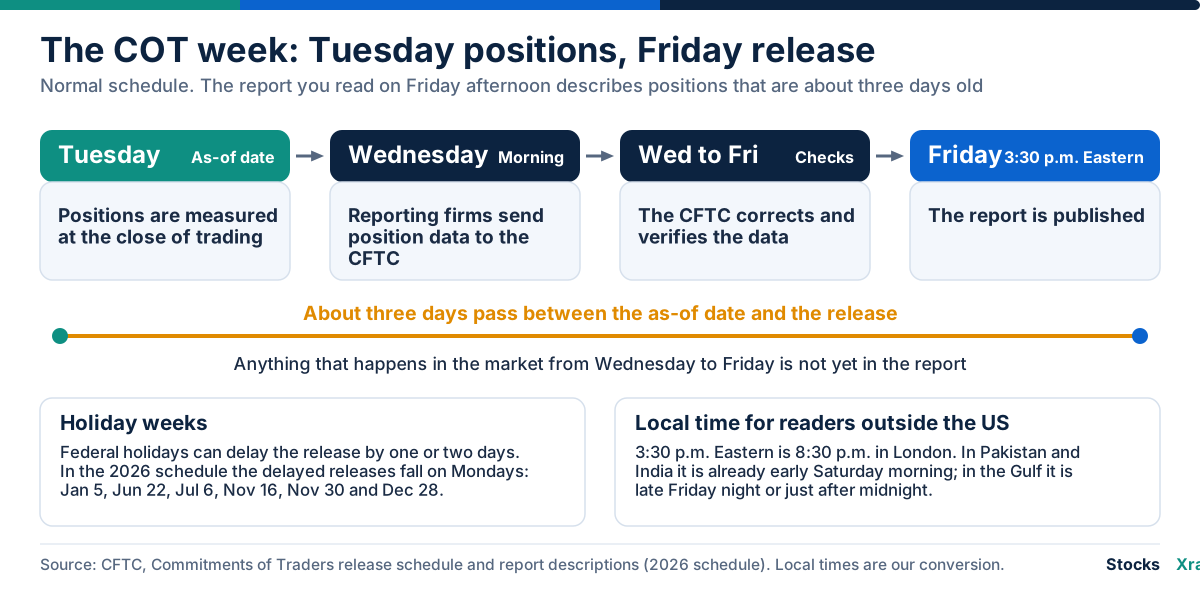
Federal holidays can delay a release by one or two days. In the 2026 schedule, six releases are marked as delayed: January 5, June 22, July 6, November 16, November 30 and December 28, each a Monday. Larger disruptions happen too. Processing and publication stopped from October 1 to November 12, 2025 during a lapse in federal funding, the CFTC then published the backlog in order, and the normal schedule resumed with the report released on December 29, 2025. A cyber-related incident at ION, which prevented timely data submission, delayed the weekly reports in early 2023.
The delay matters in two ways. Anything that moves the market between Tuesday and Friday is not yet in the report. And any back-test must date each observation to the Friday release, not the Tuesday it describes, or it uses information nobody had yet.
For readers outside the US, 3:30 p.m. Eastern is 8:30 p.m. in London for most of the year. In the Gulf it is late Friday night or just after midnight, and in Pakistan and India it is already early Saturday morning.
The report types and who is in each category
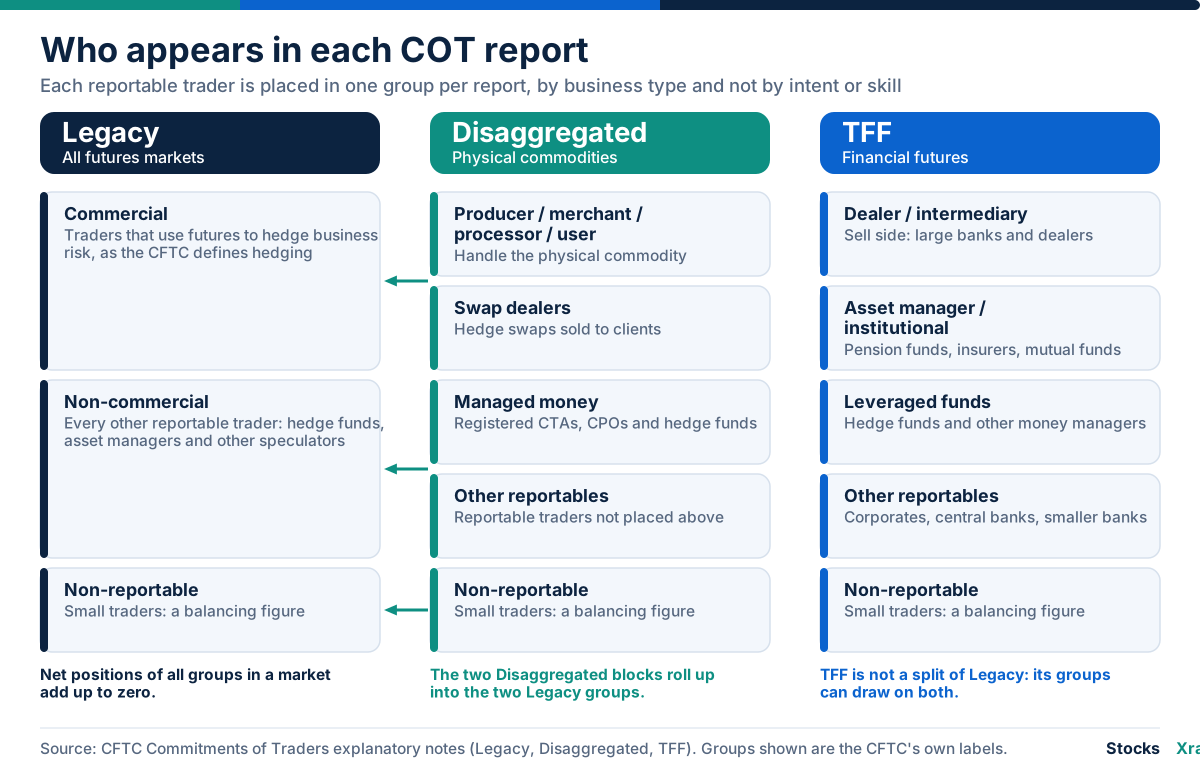
The CFTC publishes four reports, and the first step in reading any COT figure is knowing which one it comes from. Legacy, Disaggregated and TFF each come in a futures-only and a futures-and-options-combined version. The combined version converts options into futures equivalents using exchange-supplied delta factors. The Supplemental report exists only in the combined version.
| Report | What it covers | Groups | Who is usually in them |
|---|---|---|---|
| Legacy | All reported futures markets | Commercial, non-commercial, non-reportable | Commercial: traders that use the contract to hedge business risk, as defined in CFTC Regulation 1.3. Non-commercial: every other reportable trader, such as hedge funds and other speculators. Non-reportable: small traders |
| Disaggregated | Physical commodities: agriculture, petroleum, natural gas, electricity, metals | Producer/merchant/processor/user, swap dealers, managed money, other reportables, non-reportable | Producers and merchants handle the physical commodity. Swap dealers hedge swap deals with futures. Managed money is registered CTAs, CPOs and identified funds, including hedge funds |
| TFF | Financial futures: currencies, Treasuries, stock indexes, VIX | Dealer/intermediary, asset manager/institutional, leveraged funds, other reportables, non-reportable | Dealers are the sell side (large banks). Asset managers are pension funds, insurers and mutual funds. Leveraged funds are hedge funds and other money managers |
| Supplemental | 13 selected agricultural contracts | Commercial, non-commercial, index traders | Index traders are mostly passive, long-only traders that replicate a commodity index |
The CFTC, not the trader, decides who is in which group. Traders describe their predominant business on CFTC Form 40, and staff review the answer. One consequence is stated plainly by the CFTC: a trader classed as a producer, merchant, processor or user has all of its positions in that commodity counted in that group, whether a position is a hedge or a bet. In Legacy and Disaggregated a trader can sit in different groups for different commodities, while TFF applies one category across all contracts. Reclassifications, new forms and traders entering or leaving can shift the weekly numbers for reasons unrelated to market opinion.
The same market through different lenses
Two real snapshots, both from futures-only data for the report dated October 13, 2026, show why the choice of report matters. In gold, the Disaggregated report splits the two Legacy groups as follows.
| Disaggregated group | Net position (contracts) | Legacy group it sits inside |
|---|---|---|
| Producer/merchant/processor/user | −18,437 | Commercial |
| Swap dealers | −224,094 | Commercial |
| Managed money | +107,089 | Non-commercial |
| Other reportables | +100,790 | Non-commercial |
| Non-reportable | +34,652 | Non-reportable |
| Legacy totals | Commercial −242,531, non-commercial +207,879 |
Most of the commercial short in gold is held by swap dealers, whose short was 60.1% of open interest, rather than by producers and merchants at 9.3%. Only about half of the non-commercial long is managed money. Reading the Legacy commercial line as miners and jewelers hedging would be wrong here.
The yen shows a different problem. TFF is not a split of Legacy, so the two reports can point in opposite directions.
| Report | Group | Net position, yen futures (contracts) |
|---|---|---|
| Legacy | Non-commercial | +50,207 |
| Legacy | Commercial | −48,587 |
| TFF | Asset manager/institutional | +65,819 |
| TFF | Leveraged funds | −33,673 |
| TFF | Dealer/intermediary | −73,811 |
| TFF | Other reportables | +43,285 |
| Both | Non-reportable | −1,620 |
In Legacy, non-commercial traders are net long about 50,000 yen futures contracts. In TFF the hedge-fund group, leveraged funds, is net short about 34,000, because asset managers hold a net long of about 66,000. Both statements are true, and the word "speculators" hides which group is on which side.
How to read the numbers: long, short, spreading, net and open interest
Every COT table is built from a handful of columns.
- Open interest is all contracts entered into and not yet closed by a trade, delivery or exercise. Total long equals total short, because every contract has two sides.
- Long and short are the contracts a group holds on each side.
- Spreading is the part of one trader's long and short positions that offset each other, for example across contract months. If a trader holds 2,000 long and 1,500 short, the CFTC shows 500 long and 1,500 spreading. Legacy reports spreading for non-commercial traders, Disaggregated for swap dealers, managed money and other reportables, and TFF for all four groups.
- Net position is long minus short, with spreading left out. The "net speculative position" most often quoted is the Legacy non-commercial net or the Disaggregated managed money net.
- Percent of open interest divides a group's long, short or net by open interest, which makes markets of different size comparable.
- Change is the difference from the previous report.
The CFTC gives a balance rule for checking a Legacy row: open interest equals non-commercial long plus non-commercial spreading plus commercial long plus non-reportable long, and the same sum holds on the short side. In the combined version, totals can be off by one contract because of option delta rounding.
A worked example (illustrative numbers)
The figures below are invented round numbers for a Legacy-format market with 400,000 contracts of open interest. Non-commercial traders also hold 20,000 contracts of spreading, which count on both the long and the short side but stay out of net positions. None of this is data from a real market.
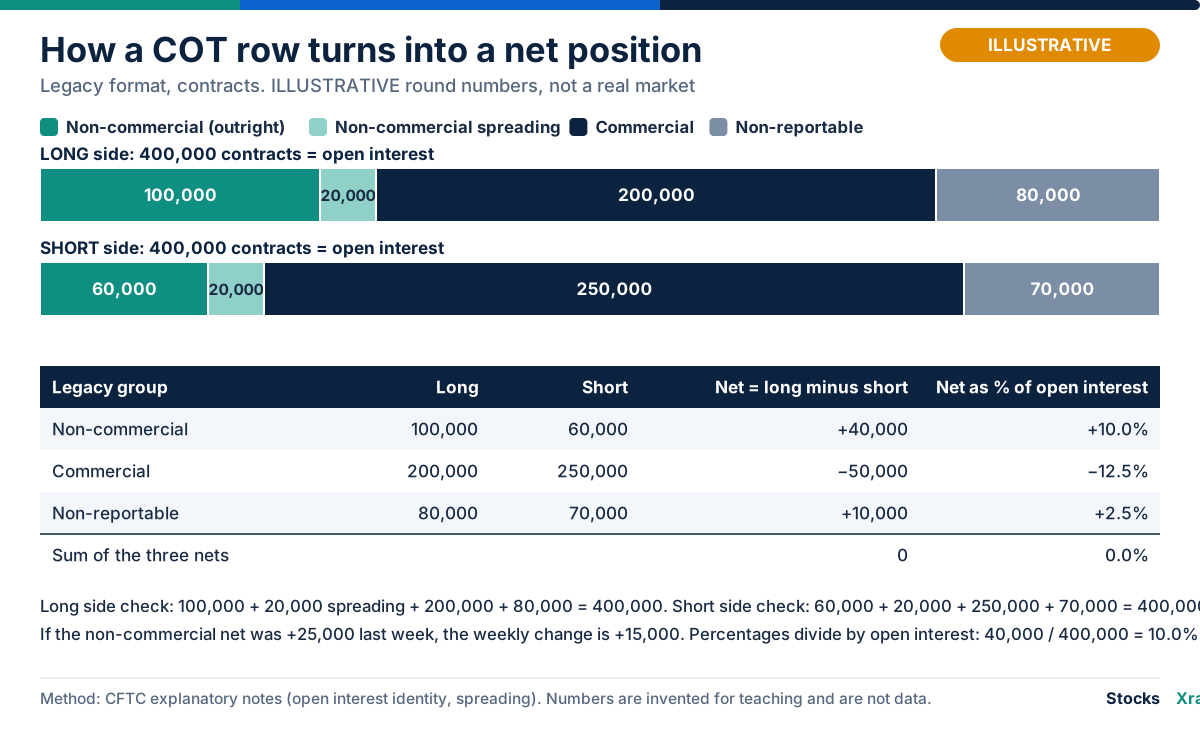
- Net each group. Non-commercial: 100,000 − 60,000 = +40,000. Commercial: 200,000 − 250,000 = −50,000. Non-reportable: 80,000 − 70,000 = +10,000.
- Check the sum. The three nets add to zero. One group's long is another group's short, so the report shows who holds the other side of each trade, not who is right.
- Scale by open interest. +40,000 / 400,000 = +10.0% for non-commercial traders, −12.5% for commercials and +2.5% for non-reportables.
- Look at the change. If the non-commercial net was +25,000 last week, the weekly change is +15,000. The long and short columns show whether it came from buying, from covering shorts, or both.
The long format also shows how much open interest the largest four and eight reportable traders hold, which indicates whether a position is broad or concentrated.
Reading positioning extremes
Comparing a net position with its own history
A single net number says little: +40,000 contracts is large in one market and small in another. Analysts therefore compare it with the same series over a past window, usually one to three years. The common method is a COT index. Subtract the lowest net in the window from today's net, divide by the high minus the low, and multiply by 100. With a one-year range of −10,000 to +60,000 in the illustrative example, a net of +40,000 gives (40,000 + 10,000) / (60,000 + 10,000) × 100, or about 71.
A percentile rank asks a different question: what share of weeks in the window had a net at or below today's. The window changes the answer. The COT pages on StocksXray show a 0 to 100 index based on each group's own 52-week range, plus a two-year rank for speculators (see Japanese yen), and state that neither is a signal.
What "crowded" means
A crowded position is one where an unusually large share of a group, or of open interest, sits on one side relative to its own history. It matters because leveraged traders that are wrong may have to cut positions, which can add to the move against them. Margin and leverage explains the mechanism, and short selling covers forced buying back. A crowded reading cannot supply timing. It describes who is positioned, not when anyone will act, and herd behavior can keep a trade popular for a long time.
Two real episodes
Two episodes recomputed from CFTC data show how extremes behave. They are selected examples, not statistical evidence.
| Episode | Reading | What followed |
|---|---|---|
| Yen futures, leveraged funds (TFF, CME), mid-2024 | Net short of about 110,000 contracts on June 25, July 2 and July 9, 2024, at the bottom of its one-year and three-year ranges | USD/JPY was 161.73 on July 10 and 143.95 on August 5, and the net short was 24,158 on August 6 |
| WTI crude, managed money (Disaggregated, NYMEX), early 2018 | Net long of 483,829 contracts on January 16, 2018, the highest weekly reading since the series began in June 2006 | WTI spot was $63.82 that day, $76.40 on October 3 and $44.48 on December 27, and the net long was 67,296 on December 18 |
In yen futures, leveraged funds held a net short between about 59,000 and 111,000 contracts in every weekly report from May 7 to July 30, 2024. The July 9 reading would normally have been published on Friday, July 12, by which time USD/JPY had already fallen to 157.88 in the Federal Reserve's H.10 series. The large net short was in place for months, and the reading at its peak was published after the turn had started.
In crude oil, the price was higher eight months after the record net long, and the big drop came in the final three months of 2018. Managed money cut its position as prices fell. In both cases the position was extreme well before the reversal, and in both it shrank as price moved.
What the research says
The studies below are the ones we could verify, and they point mostly one way.
- Klitgaard and Weir (New York Fed, 2004). Weekly changes in speculators' net positions in currency futures correlated strongly with exchange-rate moves in the same week, with a 75 percent chance of matching the direction. The positions did not predict the following week.
- Boos and Grob (2023). Across 23 commodities, trend-following explained more than 40 percent of speculators' position changes, on average. Producers behaved as contrarians, mirroring momentum traders.
- Wang (2001). In six agricultural markets, large speculators' sentiment went with price continuation and large hedgers' with reversals. The author found no sign that large speculators forecast better than others.
- Kang, Rouwenhorst and Tang (2020). Short-term position changes reflect non-commercial traders' liquidity needs, while long-term changes reflect commercial hedging. The two pull expected returns in opposite directions.
- Brunetti, Büyükşahin and Harris (2016). In 2005 to 2009 data, hedge funds traded in line with contemporaneous returns, and the study found little evidence that speculators destabilized markets in strongly trending periods.
Taken together, positions largely coincide with or follow price. The predictive findings are narrower, tied to particular markets and periods, and none of these studies establishes a rule that holds across both.
Why "commercials are always right" and "follow the smart money" are myths
- Hedgers are not forecasting. A producer sells futures to lock in a price, and the size of the position follows output and risk policy, not a view on where prices go.
- Labels come from the business, not the trade. The CFTC counts every position of a commercial-type trader in that group, hedge or not.
- Hedgers lean against the trend. Producers behave as contrarians to momentum traders, so their positions can look prescient at turning points and poorly timed in long trends. That is a by-product of hedging, not skill.
- The arithmetic cannot make everyone smart. The nets sum to zero, so if commercials were always right, everyone else would always be wrong. In gold, the largest short belongs to swap dealers hedging swap deals, which is not a forecast either.
- Small traders are a leftover, not a group of fools. Non-reportable positions are a balancing figure, and the CFTC says the number and classification of those traders are unknown.
COT report for forex: reading euro, yen and sterling positions
CME currency futures are priced in US dollars per unit of the foreign currency. The contract sizes in the CFTC data are 125,000 euros, 62,500 pounds, 12,500,000 yen, 125,000 Swiss francs, and 100,000 Canadian or Australian dollars. Each contract is a position in a foreign currency against the dollar, so a net long position means long that currency and short the dollar.
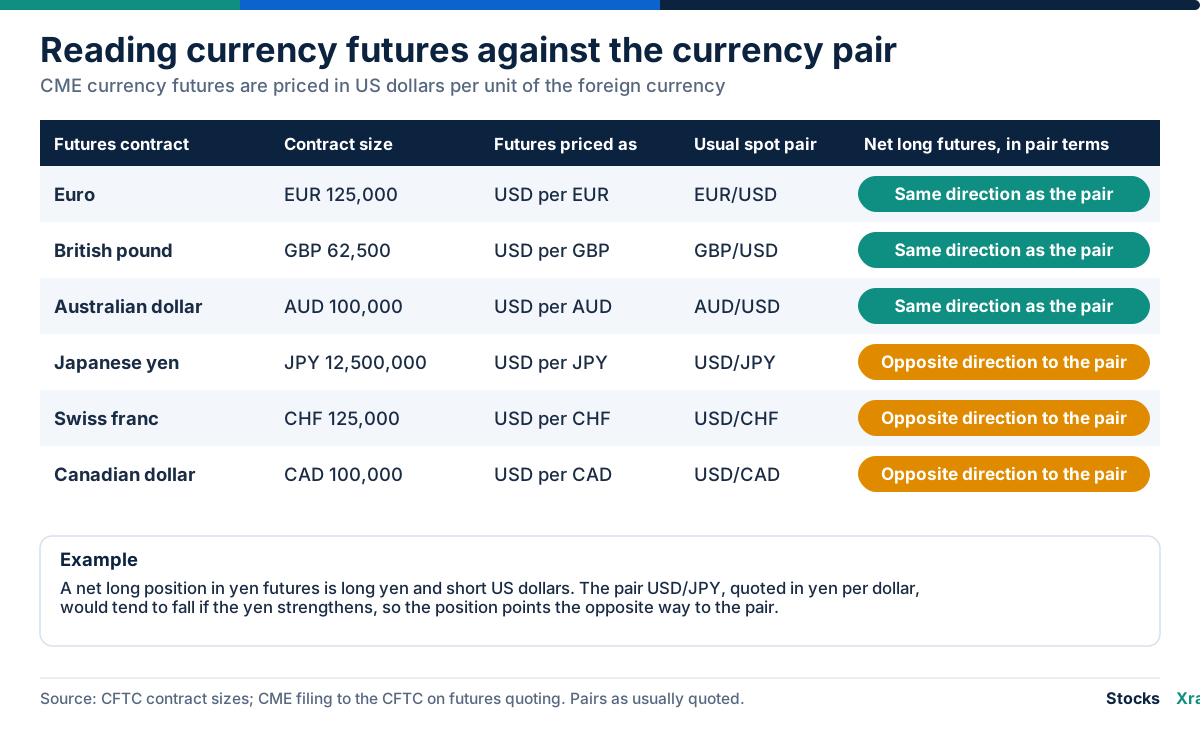
For the euro, pound and Australian dollar, the futures price is quoted the same way as the usual spot pair (EUR/USD, GBP/USD, AUD/USD), so a net long position and the pair move in the same direction. A net long euro position, for instance, gains when the euro rises against the dollar, as in EUR/USD. For the yen, Swiss franc and Canadian dollar, the usual pair has the dollar first (USD/JPY, USD/CHF, USD/CAD) and is quoted in foreign units per dollar, so the relationship inverts. A net long yen position gains if the yen strengthens, which means USD/JPY falls. CME's filing to the CFTC describes its standard currency futures as quoted in US dollars per foreign unit, which it calls "American terms".
On StocksXray, the euro and Japanese yen pages show the futures contracts themselves. The yen page does not convert to USD/JPY, so read a net long there as long yen.
Pairs without a dollar leg, such as EUR/GBP, cannot be read from one contract, because long euro futures and long pound futures are both positions against the dollar. The US dollar index and Swiss franc have their own pages. For currencies, the TFF groups are more specific than Legacy's non-commercial line, as the yen table above shows.
COT report for gold, crude oil, natural gas and grains
For physical commodities, the Disaggregated report is the more detailed view, and a few points help in reading it.
- Who holds which side. Producers and merchants hedge a physical business, while swap dealers use futures to hedge swap deals. The gold table above shows how small the producer share of the commercial short can be.
- Managed money tends to follow trends. Trend signals explain a large share of speculators' position changes, so a historically large net long in gold, crude oil, natural gas or corn often describes a market that has already trended. The 2018 crude oil episode above is an example of that.
- Crop years. For markets such as corn, wheat and soybeans, the long format splits positions into old and other crop years. The Supplemental report adds index traders in 13 agricultural contracts.
The gold market page shows the price side that the COT report leaves out.
Limits and common mistakes
- Treating old data as current. The report is at least three days old at release, and holidays or disruptions add more. A back-test that uses the Tuesday date instead of the Friday release gives false precision.
- Reading net as the whole story. A net hides offsetting positions. In gold on October 13, 2026, non-commercial spreading was 45,895 contracts in the futures-only report and 145,285 in the combined report, against a net of about +200,000.
- Ignoring the threshold and the classification. Traders below the reporting level appear only as a balancing figure, and the CFTC classifies traders by business, not by trade. For Disaggregated and TFF history before the categories existed, it applied recent classifications backward, which reduces accuracy further back.
- Mixing versions or ignoring rolls. Futures-only and combined data differ: gold open interest was 396,345 in one and 526,276 in the other on the same date. Open interest also covers every contract month, so it swings as contracts roll: yen futures open interest fell from 376,514 to 199,463 between the reports of September 10 and 17, 2024.
- Confusing correlation with prediction. Positions often follow price, so a net long is not a forecast of further gains. A large position can also outlast a trade based on it.
- Expecting restated history. The CFTC does not backdate published data, though it adjusts figures and announces corrections when it finds reporting problems, as it did in 2023. Counts of traders are hidden when a group has fewer than four.
Using COT data alongside price, rates and fundamentals
The COT report answers one question, which is who holds what, as of a Tuesday. A workable routine combines it with other evidence:
- Match the report to the market. TFF is the CFTC's report for financial futures, Disaggregated for physical commodities and Legacy covers both. Pick one and keep the same version every week.
- Scale and compare. Convert to a share of open interest, then place it against its own history and say which window you used.
- Check the price trend. Positioning that rises with a trend is the common pattern in the research above. A divergence between positioning and price is a reason to look closer, not a signal.
- Add the drivers the report cannot see. For currencies and gold, that includes rates, such as US Treasury yields and interest rates and the Fed. For oil, it includes inventories and supply, and for grains, crop reports. Currency strength shows the relative moves across majors.
- Remember the date. Anything after Tuesday is missing.
With gold at 4,164.6 as of 16 Oct 2026, the first question on a positioning page is whether the positions followed that price move or ran against it. StocksXray publishes weekly COT charts for more than 30 markets, including S&P 500 and 10-year Treasury futures, and none of the figures there is a trading signal.
Frequently asked questions
When is the COT report released? The CFTC normally releases it on Friday at 3:30 p.m. Eastern, with data as of the close on the previous Tuesday. Federal holidays can delay it by one or two days, and in the 2026 schedule the delayed releases fall on Mondays.
What is the difference between the Legacy and Disaggregated COT reports? The Legacy report sorts reportable traders into commercial and non-commercial groups. The Disaggregated report, available since September 4, 2009 for physical commodities, splits commercials into producers/merchants and swap dealers, and non-commercials into managed money and other reportables. It can be added back up to the Legacy groups. Financial futures use a separate report, TFF.
What is managed money in the COT report? Managed money is a Disaggregated group made up of registered commodity trading advisors, registered commodity pool operators and unregistered funds identified by the CFTC. Hedge funds are included whether or not they are registered. TFF's equivalent group is leveraged funds.
Is COT data free? Yes. The CFTC publishes the reports and historical files on its website at no charge, and its public reporting environment lets you search, filter and download data. The CFTC's FAQ says it is not currently issuing API tokens and that light use works without one. Some exchanges, such as ICE Futures Europe, publish their own reports.
How do you read net positions in the COT report? Subtract a group's short contracts from its long contracts, leaving out spreading. Then divide by open interest to get a share, and compare it with the same group's history. The nets of all groups in a market add up to zero, so one group's net long is always matched by others' net short.
Which markets does the COT report cover? It covers futures and options on futures in markets where at least 20 traders hold reportable positions. That includes agriculture, energy, metals, electricity, currencies, Treasuries, stock indexes and VIX, and some cryptocurrency futures. It does not cover individual stocks or most over-the-counter trades.
Does the COT report predict prices? Research does not support treating it as a standalone forecast. Studies mostly find that position changes coincide with, or follow, price moves, and positioning extremes can last for months. The CFTC does not analyze the data or make recommendations from it.
Are commercial traders the smart money? No. Commercial traders use futures to hedge business risk, and the CFTC classifies them by business, not by forecasting ability. In gold, most of the commercial short in the October 13, 2026 report belonged to swap dealers hedging swap deals.
Sources and data notes
- CFTC, Commitments of Traders: report descriptions and FAQs, plus the explanatory notes, Disaggregated notes, TFF notes, release schedule and special announcements.
- CFTC Public Reporting Environment: source of the October 13, 2026 gold and yen figures, the 2024 yen and 2018 WTI episodes and the contract sizes. Net positions, shares and index values are our arithmetic.
- 17 CFR 15.03 (reporting levels) and ICE Futures Europe COT notes (April 2025).
- Federal Reserve H.10 USD/JPY series (DEXJPUS) and EIA WTI spot price (DCOILWTICO), both via FRED.
- Research: Klitgaard and Weir, New York Fed (2004); Wang, Journal of Futures Markets (2001); Boos and Grob, Journal of Financial Markets (2023); Kang, Rouwenhorst and Tang, Journal of Finance (2020); Brunetti, Büyükşahin and Harris (2016).
Coverage: US futures positions as reported to the CFTC, with the report dated October 13, 2026 as the latest checked. The weekly charts on StocksXray's COT pages use the Legacy report in its futures-and-options-combined version, so their open interest is larger than the futures-only figures quoted above (gold: 526,276 against 396,345). Not covered: other countries' position reports (beyond ICE Futures Europe), options-only data and price forecasts.
Educational information, not financial advice.
Related reading
Educational only, not financial advice. Examples use illustrative numbers.