Commodity Prices Explained: Types, Spot vs Futures and How They Work

Commodities are standardized raw materials such as crude oil, natural gas, copper, wheat and gold, traded in bulk, where one unit of a given grade can stand in for another. Commodity prices come in three forms: the spot price for immediate delivery, the futures price for a named future month, and the share price of a fund that holds futures. This guide explains the main types, how each price is built, why commodity funds can drift from spot, who trades, and what moves prices.
Key takeaways
- A commodity is a good that is interchangeable, standardized and graded, so one unit of a grade can stand in for another. The World Bank groups its price series into energy, metals and minerals, precious metals, fertilizers and agriculture.
- There is no single price. Spot is for delivery now at a named place, every futures month has its own price, and most investors see fund prices. Our commodity pages show fund proxies, except for gold, silver, platinum and palladium, which are spot prices.
- When later futures months cost more than nearer ones (contango), a fund that rolls its contracts loses a little each month even if spot is flat. In 2024 Henry Hub gas spot rose 31.8% (US government data) while the net asset value of the United States Natural Gas Fund (UNG) fell 17.24% (the fund's annual report).
- Supply shocks, weather, inventories, costs, geopolitics and the dollar all matter, and one can swamp the rest: Brent spot rose 94% between 27 February and 7 April 2026.
What makes something a commodity
A commodity is a basic good traded in bulk in which one unit of a given grade can stand in for another. A barrel of light sweet crude from one field is, for pricing purposes, a substitute for a barrel from another field, so traders can quote one price for it. A share or a bond is different: each belongs to a specific company or borrower and carries its own risks.
Three features do most of the work.
- Fungible. The glossary of the US Commodity Futures Trading Commission (CFTC) defines fungibility as interchangeability, and notes that futures contracts for the same commodity and delivery month on the same exchange are fungible because quality, quantity, delivery date and delivery locations are standardized.
- Standardized. The exchange fixes the unit: 1,000 barrels for the main crude oil contracts, 10,000 MMBtu (million British thermal units, a standard gas unit) for Henry Hub natural gas on the New York Mercantile Exchange (NYMEX), and 5,000 bushels for corn on the Chicago Board of Trade (CBOT).
- Graded. Quality tiers trade at set premiums or discounts. On the CBOT corn contract, No. 2 yellow corn delivers at the contract price, No. 1 yellow at 1.5 cents a bushel over, and No. 3 yellow at 2 to 4 cents under. Crude oil benchmarks differ in density: the World Bank lists Brent at 38 degrees API (a density scale), West Texas Intermediate (WTI) at 40 and Dubai Fateh at 32, which is one reason there is more than one oil price.
US law defines the word broadly. The Commodity Exchange Act lists farm products such as wheat, cotton, corn, soybeans and livestock, then adds all other goods and articles, and all services, rights and interests, in which futures contracts are traded or may be traded in the future (7 U.S.C. 1a(9)), with a few carve-outs. In practice, anything with a futures market can count as a commodity.
A commodity also earns its return differently from a stock. A barrel of oil or a bar of copper pays no dividend or interest, and holding the physical good costs money for storage, insurance and financing, which the CFTC calls carrying charges. That cost feeds into futures prices, as the sections below show.
The main types of commodities
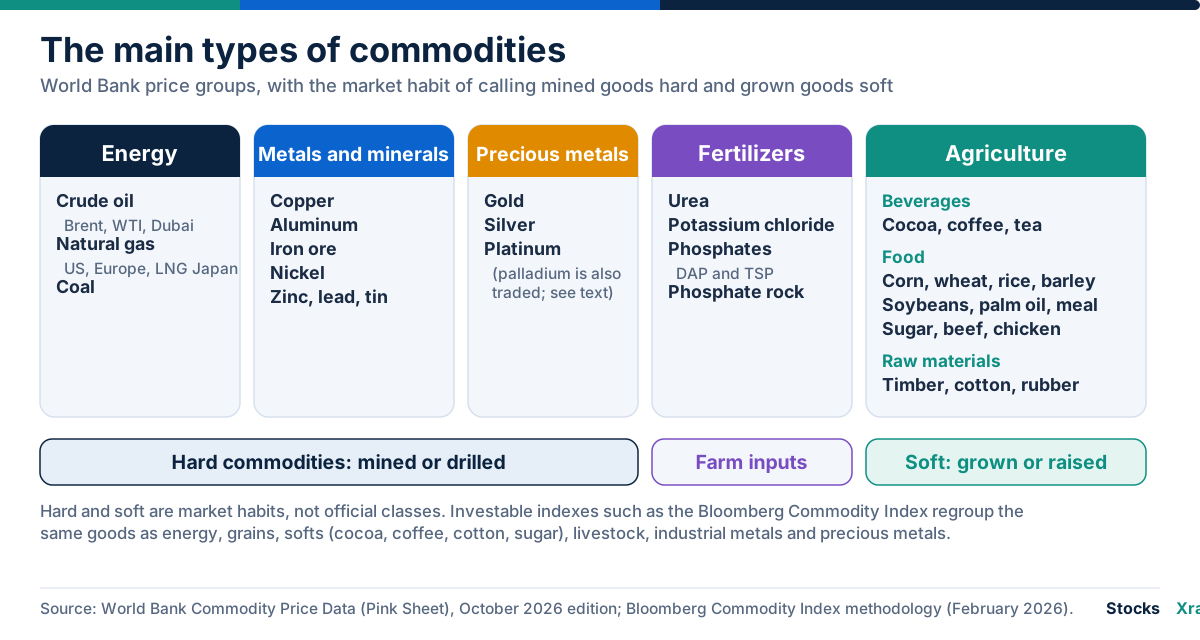
There is no single official taxonomy, but the World Bank's is the most widely used for price data. Its monthly Pink Sheet, in the October 2026 edition published on 2 October, tracks 71 price series in nominal US dollars, grouped as energy (crude oil, natural gas, coal), agriculture (beverages, food, raw materials), fertilizers, metals and minerals, and precious metals.
Investable indexes slice the market differently. The Bloomberg Commodity Index uses six groups: energy, grains, softs, livestock, industrial metals and precious metals. It holds 23 commodities for 2026, and its "softs" are cocoa, coffee, cotton and sugar.
Hard and soft commodities
Traders also split the market into hard commodities, which are mined or drilled (oil, gas, metals), and soft commodities, which are grown or raised (crops and, in many definitions, livestock). It is a market habit, not an official class, and index providers use "softs" for just four crops. The split works as shorthand for what drives supply: weather and harvest cycles for grown goods, extraction capacity and cost for mined ones.
| Group | Typical goods | Where to see it on our site |
|---|---|---|
| Energy | Crude oil, natural gas, gasoline, coal | WTI crude oil, Brent, natural gas, gasoline |
| Industrial metals | Copper, aluminum, nickel, zinc | Copper, industrial metals basket |
| Precious metals | Gold, silver, platinum, palladium | Gold, silver |
| Grains and oilseeds | Corn, wheat, soybeans, soybean oil | Corn, wheat, soybeans |
| Softs | Sugar, coffee, cocoa, cotton | Sugar; trader positions in coffee, cocoa, cotton |
| Livestock | Live cattle, lean hogs | Trader positions in live cattle |
Gold, silver, platinum and palladium are commodities too, but this guide leaves their rates aside. Our sister site GoldRateMap covers gold and silver rates for more than 250 countries and their cities, and our own gold page carries the chart.
Spot price, futures price and the number you actually see
The spot price is what a physical commodity costs for immediate delivery at a given time and place. Place and grade are part of the definition. EIA publishes WTI spot for crude at Cushing, Oklahoma, and Henry Hub spot for gas delivered at a pipeline hub in Louisiana, and Dated Brent prices North Sea cargoes loaded on a given date.
A futures price is the price agreed today for delivery in a named future month. Each month trades separately, so a commodity has a curve of prices rather than one number, and the "oil price" quoted in headlines is often the nearest, or front-month, contract.
Spot and the front-month futures price normally move together and can still part ways. In early April 2026 the Dated Brent spot price rose to a premium of more than $25 a barrel over the front-month Brent futures contract. EIA said this likely reflected extreme tightness in the very short term after the closure of the Strait of Hormuz, as buyers competed for cargoes, a scramble that spot prices capture better than futures, which price later delivery.
Most investors never see a spot or futures price directly. They see the share price of an exchange-traded fund (ETF) that holds futures. StocksXray follows that practice with one exception: gold, silver, platinum and palladium pages show the spot price in US dollars per troy ounce, and every other commodity page shows a fund proxy. The headline number on our WTI crude oil page, 161.76 as of 16 Oct 2026, is the price of one share of the United States Oil Fund (USO), not dollars per barrel. The Brent page uses the United States Brent Oil Fund (BNO), currently 67.19, and the natural gas page uses UNG, currently 10.66. The chart below shows the USO proxy.
| Source | What it shows | Frequency and unit |
|---|---|---|
| US Energy Information Administration (EIA), also republished by FRED, the St. Louis Fed's data service | Spot prices: WTI at Cushing, Brent (Europe), Henry Hub gas | Daily; dollars per barrel or per MMBtu |
| World Bank Pink Sheet | Monthly average prices for 71 series, in nominal US dollars, back to 1960 | Monthly |
| International Monetary Fund (IMF) Primary Commodity Prices | Commodity price database and country-specific price indices | Monthly |
| Futures exchanges (NYMEX, CBOT, Intercontinental Exchange or ICE) | A settlement price for each contract month | Daily; per contract unit |
| Commodity funds and ETFs | Share price and net asset value (NAV) | Daily; dollars per share |
| StocksXray commodity pages | Spot for four precious metals, fund proxies for the rest | Updated each night after the markets close |
How a commodity futures contract works
A futures contract is an exchange-listed agreement to buy or sell a set quantity of a standardized commodity at a set price for delivery in a set month. Our futures contracts basics post covers the general mechanics. For commodities, four terms matter most: the contract size, the delivery months and last trading day, how the contract settles, and margin.
| Contract | Size | Months and last trading day | Settlement |
|---|---|---|---|
| NYMEX WTI crude oil | 1,000 barrels | Monthly. Trading ends three business days before the 25th calendar day of the month before delivery, with a one-day adjustment if the 25th is not a business day | Physical delivery at Cushing, Oklahoma |
| ICE Brent crude oil | 1,000 barrels | Monthly. Trading ends on the last business day of the second month before the contract month | Delivery through an exchange-for-physical transfer, with an option to cash settle against the ICE Brent Index |
| NYMEX Henry Hub natural gas | 10,000 MMBtu | Monthly | Delivery at Henry Hub, Louisiana |
| CBOT corn | 5,000 bushels | March, May, July, September, December | Physical delivery of No. 1, 2 or 3 yellow corn at set price adjustments |
Few traders take delivery. EIA notes that only about 1% of futures traded go to physical delivery, and the CFTC says most contracts are liquidated before the delivery date. A trader who does not want the commodity closes the position before expiry, or moves it into a later month, which is called rolling.
Buyers and sellers also post margin, a good-faith deposit that the CFTC glossary equates with a performance bond: initial margin when the position opens and maintenance margin that must stay on deposit afterward. The United States Oil Fund's annual report puts the deposit at generally 5% to 30% of a contract's value. Accounts are marked to market every trading day, and margin is not a down payment on the commodity. See margin and leverage for the mechanics.
A short illustration shows why this matters. One Brent contract covers 1,000 barrels, so at an illustrative $100 a barrel it controls $100,000 of oil, and each $1 move is worth $1,000. The ICE minimum price move of one cent is worth $10. If the margin were 10% ($10,000, illustrative), a 10% price move would equal the entire deposit.
Contango and backwardation: the shape of the futures curve
The CFTC glossary defines contango as a market in which prices for later delivery months are progressively higher than the nearest month, and backwardation as the reverse. Carrying charges help explain contango: if a buyer must pay to store, insure and finance a barrel, later delivery costs more. Backwardation tends to appear when supply is tight now. EIA wrote in November 2021 that low crude inventories had put upward pressure on near-dated contracts while longer-dated contracts were lower, a sign of an expected balance later.
The shape changes. UNG's annual report notes that because natural gas demand is seasonal, the curve can swing from backwardation to contango and back within a year. As a contract approaches expiry its price moves toward the spot price for the same grade and place, a process the CFTC glossary calls convergence. That convergence is what turns curve shape into a cost or a gain for anyone who rolls.
Worked example: what a roll costs (illustrative)
Take round numbers. Spot oil is 100 and stays at 100. A fund holds the front-month contract and, each month, sells the expiring contract and buys the next one.
| Contango | Backwardation | |
|---|---|---|
| Curve (months 1 to 6) | 100, 102, 104, 106, 108, 110 | 100, 98, 96, 94, 92, 90 |
| Each monthly roll | Sell at 100, buy at 102 | Sell at 100, buy at 98 |
| Effect as the bought contract converges to 100 | 100 / 102 - 1 = -1.96% | 100 / 98 - 1 = +2.04% |
| After 12 rolls, starting at 10,000, spot unchanged | About 7,885 (-21.2%) | About 12,743 (+27.4%) |
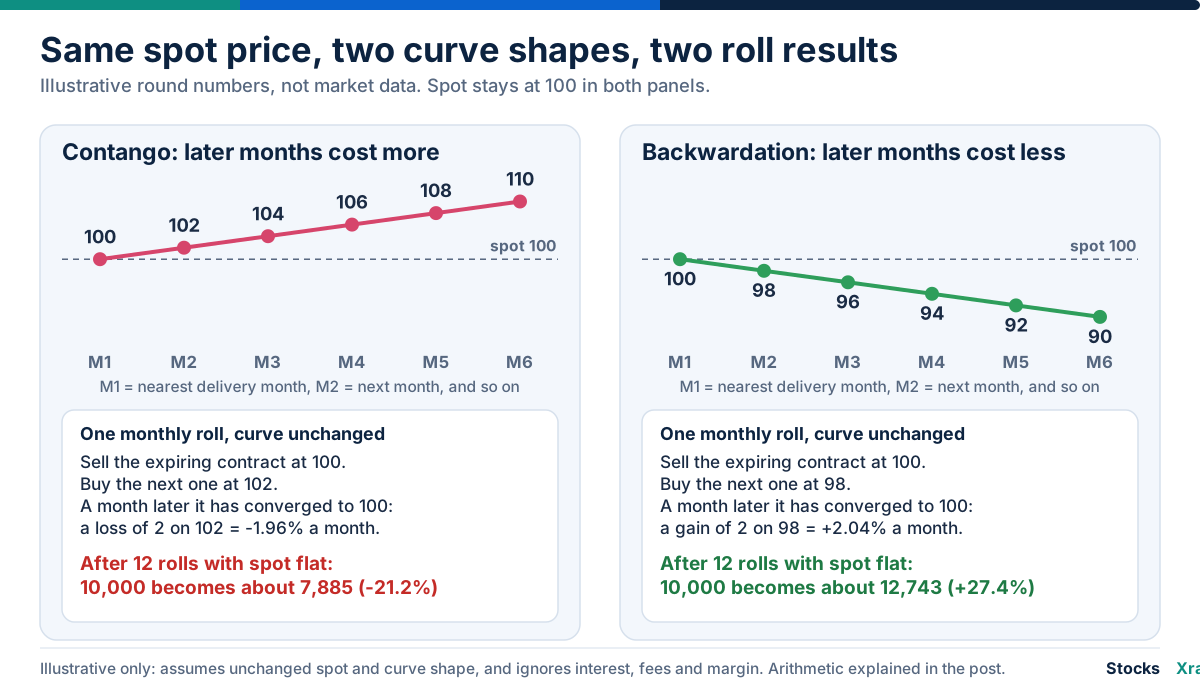
Real curves change shape daily, spot moves, and a fund also earns interest on its cash and pays fees. The example shows the direction and rough size of the effect, not a forecast of any fund's return.
Why commodity funds and ETFs drift from spot
Buying and storing physical barrels or tons is impractical for most investors, so commodity funds hold futures instead. UNG and USO are commodity pools that keep the front-month contract and roll it forward. USO changes its benchmark into the next month over five days each month, and UNG's benchmark moves to the next month over four days once the nearer contract is within two weeks of expiry.
Both funds state in their annual reports (Form 10-K) that they do not aim to equal the spot price in dollar terms, nor to match any futures contract over periods longer than a day. Their objective is for daily percentage changes in NAV to follow the benchmark futures contract, and over longer periods contango and backwardation can pull the total return away from a direct holding of the commodity. The fund documents give the real numbers.
| Fund and spot series | Year | Spot change | Benchmark futures (per 10-K) | Fund NAV total return |
|---|---|---|---|---|
| UNG vs Henry Hub gas | 2024 | +31.8% | -22.46% | -17.24% |
| UNG vs Henry Hub gas | 2025 | +17.6% | -32.10% | -27.60% |
| USO vs WTI Cushing | 2024 | +0.8% | +6.47% | +12.76% |
| USO vs WTI Cushing | 2025 | -21.0% | -10.55% | -8.42% |
Spot is the EIA price on the last trading day of the prior year and of the year: Henry Hub gas $2.58 (29 December 2023), $3.40 (31 December 2024) and $4.00 (31 December 2025); WTI $71.89, $72.44 and $57.26 on the same dates. Fund and benchmark returns come from each fund's Form 10-K for 2025, which also gives UNG's NAV (adjusted for its 2024 reverse split) at $20.36, $16.85 and $12.20, and USO's at $66.91, $75.45 and $69.10.
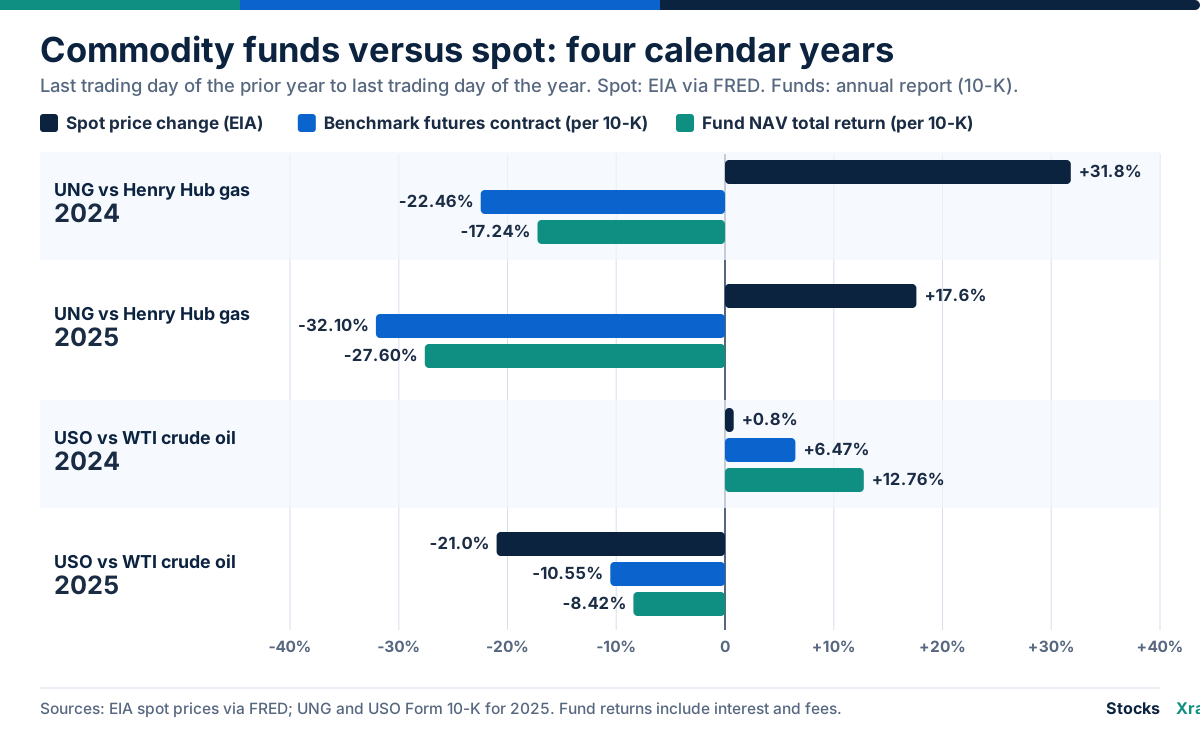
Read this as a lesson in drift, not a verdict on two funds. Gas spot ended both years higher, yet UNG fell in both. The benchmark, a front-month position rolled every month, lost 22.46% and 32.10%, so most of the gap to spot arises in the futures contracts themselves, before any fund fees, and the fund's documents point to contango and backwardation as the mechanism. The fund beat its own benchmark by 5.22 and 4.50 points. Oil went the other way: USO finished ahead of WTI spot in both years. Its report says returns reflect interest on collateral, expenses and the effect of rolling, and does not split the gap, so no single cause should be assumed. These are single-date comparisons and fund returns include interest and fees.
The structure can also fail at expiry. The May 2020 WTI contract settled at -$37.63 a barrel on 20 April 2020, the day before it expired, after an intraday low of -$40.32, according to the CFTC. EIA's Cushing spot price that day was -$36.98, and storage at Cushing was 76% full on 17 April. CFTC staff noted that almost all open positions in the May contract had been closed or rolled to later months by the open of 20 April, including those of commodity index funds and ETFs.
Two other differences are worth knowing. UNG's annual report says it is not an investment company under the Investment Company Act of 1940, so the protections that apply to registered funds do not apply, and its investors receive Schedule K-1 tax forms. It also states a management fee of 0.50% to 0.60% of NAV, depending on asset size. Our guide to what an ETF is covers the standard structure.
Who trades commodities
The CFTC divides futures participants into two broad groups. Most are commercial or institutional producers and consumers of commodities: hedgers, who use futures to reduce the risk of loss from price changes. The others are speculators, who aim to profit from price changes.
A third group is index and fund investors. Index providers such as Bloomberg build benchmarks from futures, and funds replicate them. The CFTC has published a Supplemental report since 2007 that shows index traders' positions in selected agricultural markets.
The weekly Commitments of Traders report shows how these groups are positioned. We explain how to read it in how to read the COT report, and our WTI crude oil positioning page shows the latest CFTC data.
What moves commodity prices
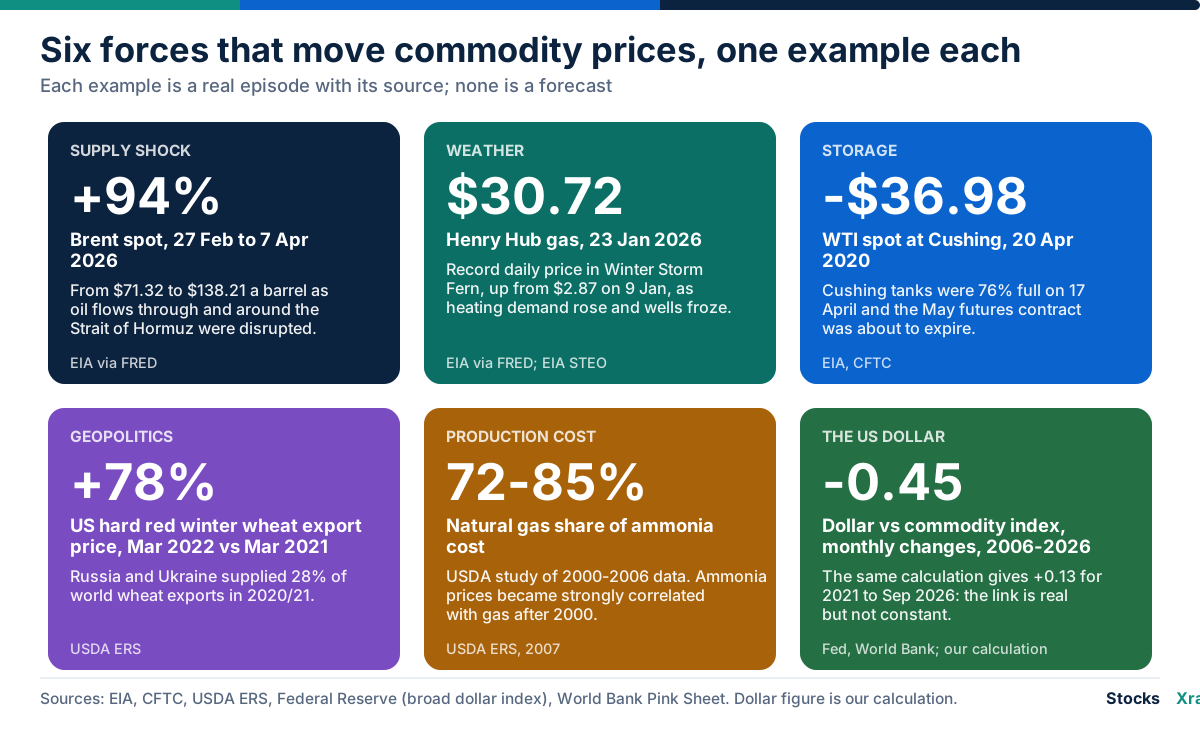
Every commodity price is supply meeting demand at a place and time, with storage and the futures curve in between. Six forces recur, and each has a recent, dated example.
Supply shocks and geopolitics
Brent spot, EIA's series via FRED, went from $71.32 on 27 February 2026 to $138.21 on 7 April, a rise of 94%. EIA's October 2026 outlook estimates that crude production shut-ins linked to the Strait of Hormuz disruption peaked at 10.9 million barrels a day in May and averaged 4.8 million in September, when Brent spot averaged $114. For how producer groups fit in, see OPEC explained.
Grain shows the same pattern. Russia and Ukraine together supplied 28% of world wheat exports in 2020/21, according to USDA's Economic Research Service (ERS), and US export prices for hard red winter wheat were 78% higher in March 2022 than a year earlier.
Demand and the economic cycle
The USO annual report notes that crude oil demand correlates closely with economic growth, so recessions tend to cut it. Demand and processing can also sit in one country. The US Geological Survey (USGS) estimates China refined 14.0 million of the world's 29.0 million tonnes of copper in 2025 (48%) while mining 1.8 million of 23.0 million, so one economy's industrial demand and trade policy carry real weight in that market.
Inventories and storage
Stocks of a commodity decide how well a market absorbs a shock. EIA's weekly natural gas storage report showed a record 360 billion cubic feet (Bcf) drawn from Lower 48 storage in the week ending 30 January 2026, 89% above the five-year average for that week. In oil, the April 2020 episode above shows what happens when tanks near capacity, and EIA's October 2026 outlook cites ongoing withdrawals of global oil inventories as one pressure on prices.
Weather
Winter Storm Fern lifted Henry Hub spot from $2.87 on 9 January 2026 to a nominal record of $30.72 on 23 January; EIA reported a January average of $7.72, against $4.26 in December, as heating demand rose and well freeze-offs cut output. On farms, the US corn yield fell to 123.4 bushels an acre in the 2012 drought from 147.2 in 2011, and production was 13% lower (USDA National Agricultural Statistics Service, January 2013). The World Bank's US Gulf maize price averaged $267.3 a tonne in June 2012 and $333.1 in July, up 24.6%.
Production costs and regional markets
Costs link one commodity to another. A 2007 USDA study found natural gas is the primary raw material for ammonia, at about 33 MMBtu a ton and 72% to 85% of production cost, and that ammonia prices became strongly correlated with gas prices after 2000. Regional markets can also diverge widely: in August 2022 the World Bank's monthly gas averages were $70.04 per MMBtu in Europe, $21.21 for Japan's liquefied natural gas (LNG) imports and $8.79 in the US, so there is no single world gas price.
The US dollar
Most benchmark prices are quoted in dollars: WTI per the CFTC, Brent per ICE, and Pink Sheet prices in nominal dollars. A weaker dollar therefore tends to lift dollar prices, and a stronger one to weigh on them. We tested this with public data, correlating monthly changes in the Federal Reserve's broad dollar index with the World Bank's total commodity price index, which excludes precious metals. From January 2006 to September 2026 the correlation is -0.45 across 248 monthly changes, and it is -0.72 for 2006 to 2010. For 2021 to September 2026, a stretch that includes the 2022 and 2026 energy shocks, it is +0.13. The link is real, and other forces can override it.
Limits and risks
- A proxy is not the commodity. A fund price and a barrel price are different units, and funds drift from spot because of rolling, fees and interest. Compare like with like.
- There is more than one price. On 14 October 2026 EIA's Brent spot was $126.55 and WTI spot $101.91. Grade, location and delivery month all change the quote.
- Futures are leveraged. Margin is a fraction of contract value, daily marking to market can force a position closed, and losses can exceed the deposit.
- Curves turn. A market in backwardation can move to contango, and a fund's roll result changes with it.
- Forecasts miss. EIA's February 2026 outlook expected Brent to average $58 in 2026, while its October outlook put the 2026 average at $96, after nine months of actual prices. Our commodity calls page says openly that the replayed edge of its model is small and not statistically proven.
- Read the documents. Funds such as UNG are commodity pools outside the Investment Company Act of 1940, issue K-1 tax forms and set out fees and risks in their annual reports and prospectuses.
Frequently asked questions
What are commodities? Commodities are basic goods, such as oil, natural gas, metals and crops, that are traded in bulk and are interchangeable within a grade. Exchanges standardize the unit, quality and delivery terms so that one contract is the same as another. In US law, almost any good with a futures market can qualify.
What are the main types of commodities? The World Bank groups its price series into energy, metals and minerals, precious metals, fertilizers and agriculture. Investable indexes use energy, grains, softs, livestock, industrial metals and precious metals. Traders also call mined or drilled goods hard commodities and grown or raised goods soft commodities.
Where can I find commodity prices? EIA publishes daily spot prices for WTI, Brent and Henry Hub gas, and the World Bank Pink Sheet and the IMF publish monthly series. Exchanges such as NYMEX, CBOT and ICE publish futures settlement prices by contract month. Our commodities page shows spot prices for four precious metals and fund proxies for the rest.
What is the difference between the spot price and the futures price? The spot price is for immediate delivery at a given time and place. A futures price is agreed today for delivery in a named future month, and each month has its own price. They normally move together but can diverge, as Dated Brent and front-month Brent futures did in April 2026.
What are contango and backwardation? Contango means later futures months cost more than nearer ones, and backwardation means they cost less. Storage, insurance and financing costs tend to produce contango, and tight nearby supply tends to produce backwardation. Both change a rolling fund's return even when the spot price is flat.
Why does a commodity ETF not match the spot price? Most commodity ETFs hold futures, not the physical good, and must replace expiring contracts each month. In contango that costs money and in backwardation it can add to returns, and interest on collateral and fees also count. UNG's 2024 return of -17.24% against a 31.8% rise in Henry Hub spot is one example.
Who trades commodities? Producers and consumers hedge price risk with futures, speculators take the other side hoping to profit from price changes, and index and fund investors hold diversified futures-based exposure. The CFTC's weekly Commitments of Traders report shows their positions. See how to read the COT report.
Does a stronger dollar lower commodity prices? Most commodities are priced in dollars, so a stronger dollar tends to push dollar prices down and a weaker one tends to push them up. Our calculation of monthly changes from 2006 to September 2026 gives a correlation of -0.45, but it was +0.13 from 2021 to September 2026. The link is not stable, and supply shocks can override it.
Sources and data notes
- World Bank, Commodity Price Data (the Pink Sheet), October 2026: https://www.worldbank.org/en/research/commodity-markets
- US Energy Information Administration: spot prices via FRED (WTI https://fred.stlouisfed.org/series/DCOILWTICO, Brent https://fred.stlouisfed.org/series/DCOILBRENTEU, Henry Hub https://fred.stlouisfed.org/series/DHHNGSP); Short-Term Energy Outlook, February and October 2026: https://www.eia.gov/outlooks/steo/; Today in Energy, 27 April 2020 (https://www.eia.gov/todayinenergy/detail.php?id=43495), 18 November 2021 (https://www.eia.gov/todayinenergy/detail.php?id=50396), 5 February 2026 (https://www.eia.gov/todayinenergy/detail.php?id=67124) and 24 April 2026 (https://www.eia.gov/todayinenergy/detail.php?id=67544)
- CFTC: Futures Market Basics https://www.cftc.gov/LearnAndProtect/EducationCenter/FuturesMarketBasics/index.htm; glossary https://www.cftc.gov/LearnAndProtect/EducationCenter/CFTCGlossary/index.htm; Interim Staff Report on the WTI contract, April 2020 https://cftc.gov/media/5296/InterimStaffReportNYMEX_WTICrudeOil/download; Commitments of Traders https://www.cftc.gov/MarketReports/CommitmentsofTraders/AbouttheCOTReports/index.htm
- Commodity Exchange Act, 7 U.S.C. 1a(9): https://www.law.cornell.edu/uscode/text/7/1a
- ICE, Brent Crude Futures contract specifications: https://www.ice.com/products/219/Brent-Crude-Futures
- Bloomberg Commodity Index Methodology, February 2026: https://assets.bbhub.io/professional/sites/27/BCOM-Methodology-FEB-2026.pdf
- Fund annual reports (Form 10-K for 2025), SEC EDGAR: United States Natural Gas Fund https://www.sec.gov/Archives/edgar/data/1376227/000110465926021507/ung-20251231x10k.htm; United States Oil Fund https://www.sec.gov/Archives/edgar/data/1327068/000110465926021501/uso-20251231x10k.htm; Teucrium Commodity Trust https://www.sec.gov/Archives/edgar/data/1471824/000143774926006385/weat20251231_10k.htm
- USDA: NASS news release of 11 January 2013 https://www.nass.usda.gov/Newsroom/archive/2013/01_11_2013.php; ERS Charts of Note, 22 April 2022 https://www.ers.usda.gov/data-products/charts-of-note/103793; ERS, Impact of Rising Natural Gas Prices on U.S. Ammonia Supply, 2007 https://www.ers.usda.gov/media/9339/wrs-0702.pdf
- US Geological Survey, Mineral Commodity Summaries 2026, Copper: https://pubs.usgs.gov/periodicals/mcs2026/mcs2026-copper.pdf
- Federal Reserve broad dollar index via FRED: https://fred.stlouisfed.org/series/DTWEXBGS
- IMF, Primary Commodity Prices: https://www.imf.org/en/Research/commodity-prices
This guide covers what commodities are, how prices are formed and quoted, and why fund proxies differ from spot. It does not cover gold rates, trade ideas, price forecasts or tax advice, and it gives no view on any fund. Dated figures are as of 19 October 2026 unless stated. Futures contract terms can change, so check the exchange's current specifications before relying on them.
Educational information, not financial advice.
Related reading
Educational only, not financial advice. Examples use illustrative numbers.