What Is a Pip? Pip Value, Lot Sizes, Spreads and Leverage Explained
A pip is the standard unit used to quote small moves in a currency pair: 0.0001 for most pairs and 0.01 for pairs that include the Japanese yen. What a pip is worth in money depends on the pair, the position size and your account currency. This guide shows how to read a quote, convert pips into dollars, size a position in lots, price spreads and other costs, and see what leverage does to a loss, with the regulatory limits and published loss rates for retail accounts.
Key takeaways
- A pip is 0.0001 for most pairs and 0.01 for yen pairs. It is a quoting convention, and a pipette is one tenth of a pip.
- Pip value is pip size times position size, converted into your account currency. On a USD-quoted pair such as EUR/USD, one standard lot of 100,000 units is worth $10 per pip, a mini lot $1 and a micro lot $0.10.
- The spread is a cost paid on every trade, measured in pips. With commission, slippage and swap, a round trip can cost several pips before the price moves.
- Leverage multiplies percent gains and losses. In the illustrative example below, the same 1% adverse move costs 30% of a $10,000 account at 30:1 and 100% of it at 100:1.
- Retail leverage on major pairs is capped at 30:1 in the UK and EU, and US minimum deposits imply 50:1. Providers must also disclose how many retail accounts lose money.
What a pip is and how to count pips
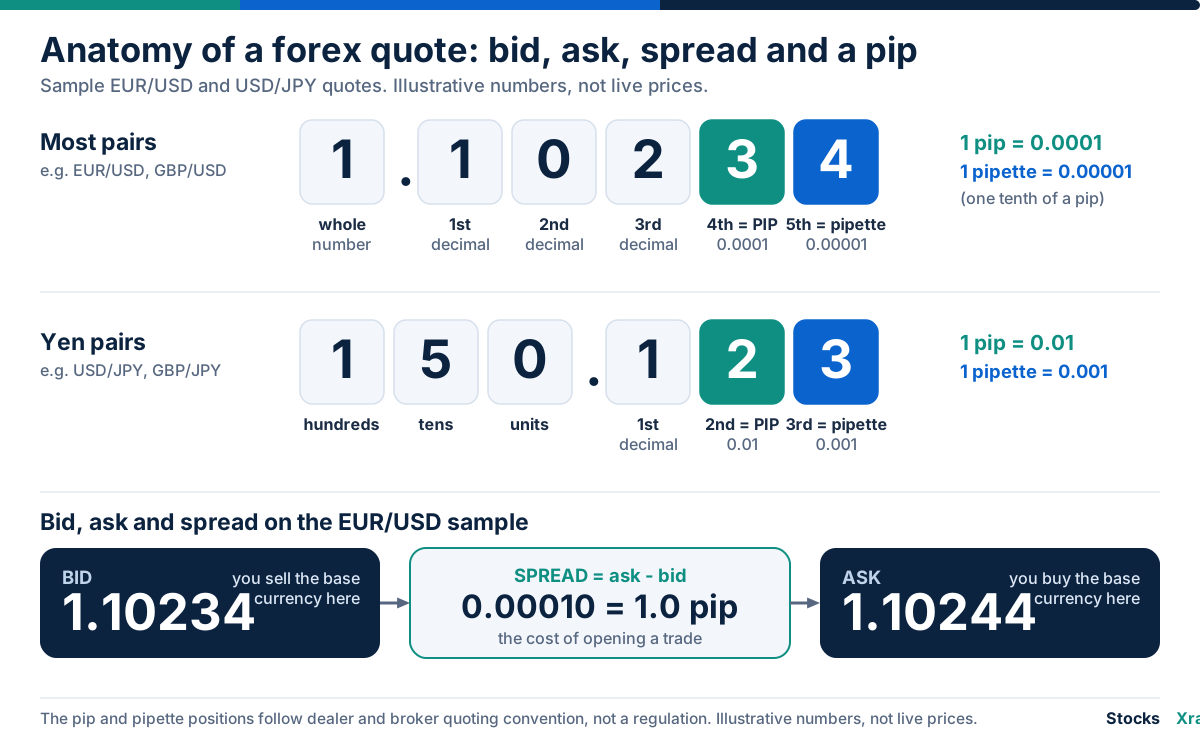
For most currency pairs the pip is the fourth decimal place, which is 0.0001. For pairs quoted in Japanese yen it is the second decimal place, 0.01. The yen is worth far less per unit, so yen rates run into the hundreds, and a pip of 0.01 keeps the step at a similar fraction of the price. Many brokers show one extra digit, a fractional pip often called a pipette, worth one tenth of a pip: the fifth decimal for most pairs and the third for yen pairs.
| Quote type | Example quote (illustrative) | Pip | Pipette |
|---|---|---|---|
| Most pairs, such as EUR/USD or AUD/USD | 1.10234 | 4th decimal (0.0001) | 5th decimal (0.00001) |
| Yen pairs, such as USD/JPY or GBP/JPY | 150.123 | 2nd decimal (0.01) | 3rd decimal (0.001) |
The pip is a market convention for talking about price distance, not a legal or regulated unit, and platforms differ in how many digits they display. Check the contract specification of what you trade, because gold, indices and other products define their own price steps.
Counting pips is subtraction. A EUR/USD quote that moves from 1.10234 to 1.10534 has changed by 0.00300, which is 30 pips. A USD/JPY quote that moves from 150.123 to 150.623 has changed by 0.500, which is 50 pips.
Every quote names two currencies. In EUR/USD the euro is the base currency and the US dollar is the quote currency, so a quote of 1.1000 means one euro costs 1.1000 US dollars. Buying the pair means buying the base and selling the quote; selling does the reverse. Selling a pair you do not hold is the currency version of short selling, covered for stocks in our short selling post.
The Bank for International Settlements (BIS) Triennial Survey put average daily foreign exchange turnover at $9.5 trillion in April 2025 (its preliminary release in September 2025 said $9.6 trillion), with the US dollar on one side of 89% of trades. Liquid pairs such as EUR/USD and USD/JPY trade in such volume that their prices move in very small steps, which is what the pip describes.
A pip is not a percentage. A one-pip move is 0.0001, which is about 0.009% of an illustrative EUR/USD price of 1.1000 and about 0.007% of an illustrative USD/JPY price of 150.00. Only near a price of 1.0000 would a pip equal 0.01%.
How pip value works
A pip is a distance in price. Pip value is what that distance is worth on your position, in your account currency, in four steps:
- Find the pip value in the quote currency: pip size multiplied by the position size in units of the base currency.
- If your account is in the quote currency, that is the answer.
- If your account is in the base currency, divide the quote-currency amount by the pair's exchange rate.
- If your account is in neither currency (a cross pair), convert the quote-currency amount into your account currency using the exchange rate between those two currencies.
The three examples below use a US dollar account and one standard lot of 100,000 units. The rates are round, illustrative numbers chosen to keep the arithmetic easy, not today's rates.
Example 1, a USD-quoted pair (EUR/USD). The pip is 0.0001. For 100,000 euros, 0.0001 multiplied by 100,000 is $10.00, and the quote currency is already the dollar, so no conversion is needed. Each pip is worth $10.00.
Example 2, a yen pair (USD/JPY at an illustrative 150.00). The pip is 0.01. For 100,000 units, 0.01 multiplied by 100,000 is 1,000 yen. The dollar is the base currency here, so divide by the rate: 1,000 divided by 150.00 is about $6.67 per pip. A 50-pip move on this position is about $333.
Example 3, a cross pair (EUR/GBP, with an illustrative GBP/USD of 1.2500). The pip is 0.0001. For 100,000 euros, the pip is worth 10 pounds. Neither currency is the dollar, so convert pounds into dollars at the GBP/USD rate: 10 multiplied by 1.2500 is $12.50 per pip.
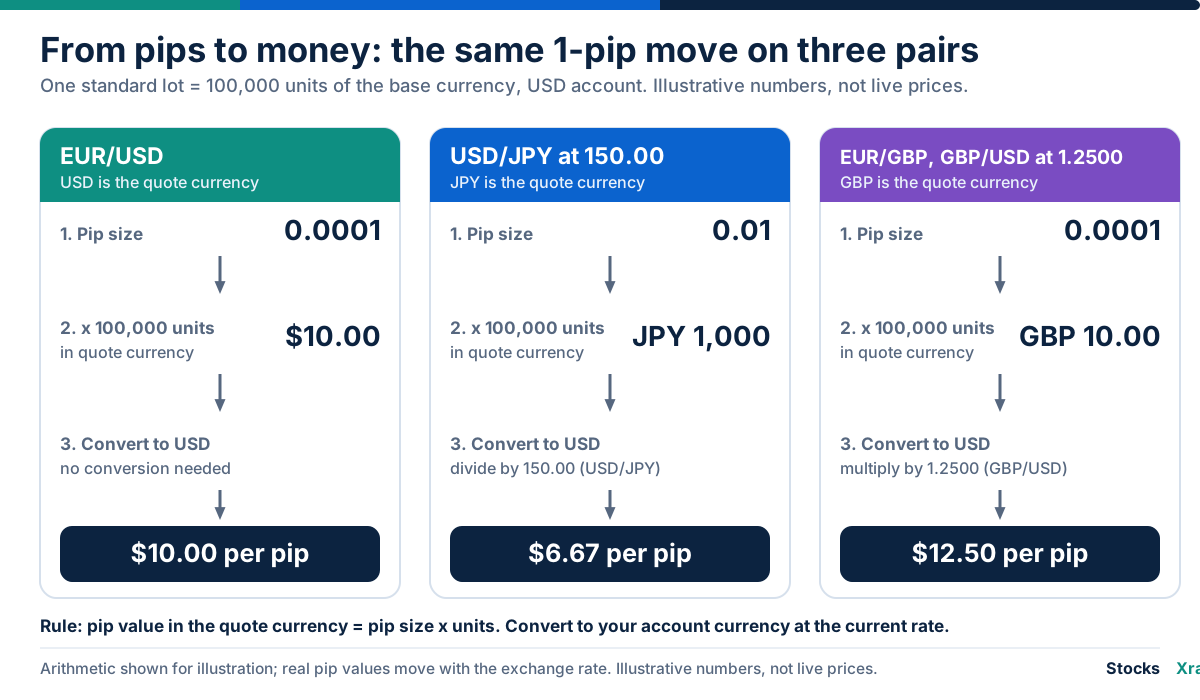
A pip has a fixed value only when the pair's quote currency is your account currency. Otherwise it moves with the exchange rate: if the illustrative USD/JPY rate in example 2 rose from 150.00 to 155.00, the same 1,000 yen would be worth about $6.45 per pip, down from $6.67. To convert an amount between two currencies at the latest rate, the EUR to USD converter and the other pages under /convert use live data.
Lot sizes, position size and notional value
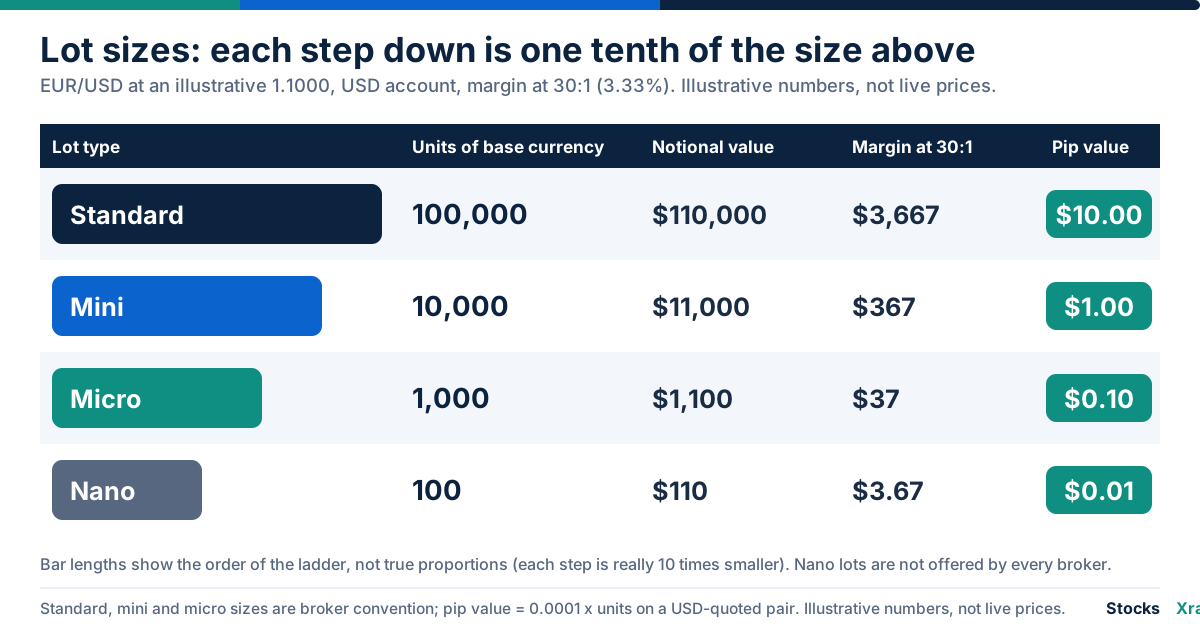
A lot is a standard trade size. By convention a standard lot is 100,000 units of the base currency, a mini lot is 10,000 units and a micro lot is 1,000 units. Some brokers also offer a nano lot of 100 units. These are retail-market conventions, not rules, so not every broker offers every size, and some simply quote trade sizes in units.
The table shows what each size is worth per pip on a USD-quoted pair for a US dollar account.
| Lot type | Units of base currency | Pip value (USD-quoted pair, USD account) | A 10-pip move | A 50-pip move |
|---|---|---|---|---|
| Standard | 100,000 | $10.00 | $100 | $500 |
| Mini | 10,000 | $1.00 | $10 | $50 |
| Micro | 1,000 | $0.10 | $1 | $5 |
| Nano | 100 | $0.01 | $0.10 | $0.50 |
A position also has a notional value, which is its full size at the current price. At an illustrative EUR/USD of 1.1000, the notional value is $110,000 for a standard lot, $11,000 for a mini, $1,100 for a micro and $110 for a nano, although margin at 30:1 would be only about $3,667, $367, $37 and $3.67. A 1% price move on a standard lot is $1,100, whatever the size of the deposit.
How many lots to trade is a position sizing question. Our position sizing post explains how risk per trade translates into size, and the volatility section below applies the arithmetic to pips.
What a trade costs: spread, commission, slippage and swap
Bid, ask and spread
Every quote has two prices. The bid is the price at which the dealer buys the base currency from you, and the ask is the price at which it sells the base currency to you. The spread is the ask minus the bid: in the illustrative quote at the top of this article, 1.10244 minus 1.10234 is 0.00010, or 1.0 pip.
To convert a spread into money, multiply it by the pip value of your position. A 1.0-pip spread costs $10 on one standard lot of a USD-quoted pair, $1 on a mini lot and $0.10 on a micro lot. As a share of notional value, 0.0001 on an illustrative price of 1.1000 is about 0.009%. The cost is built into the price: you buy at the ask and could only sell straight back at the bid.
Spreads are not fixed: one UK-regulated broker's risk disclosure says its spread changes with the underlying market. Spreads are generally tightest on the most heavily traded pairs: Bank of England data for the UK market in April 2025 show USD/EUR at 25% of turnover, USD/JPY at 14% and USD/GBP at 11%. They tend to be wider on thinly traded crosses and exotic pairs, and in thin or fast markets. Typical ranges are not given here because they vary by broker, account type and time of day. Our bid-ask spread post covers quotes and liquidity, and the forex market hours page shows when activity peaks.
Commission and slippage
Some accounts build the whole cost into the spread. Others quote a narrower spread and add a commission per lot, so the two compare only once added up in the same unit.
Slippage is the gap between the price you expected and the price at which your order fills. It happens when the market moves faster than the order can be executed; a broker's disclosure notes that a pending order can fill at a worse price than specified in volatile conditions. A stop order becomes a market order when triggered, so it can fill beyond the stop price, as covered in our posts on market, limit and stop orders and stop-loss orders.
Swap, or rollover
Holding a position past the broker's daily cutoff (5 p.m. New York time at OANDA, for example) triggers a financing charge or credit called swap or rollover. It exists because a position in a pair means holding one currency and owing another, so it carries two interest rates. The charge reflects the difference between them, adjusted by the broker's own fee. One broker's published method is position value times an annual funding rate times 1/365, with separate rates for long and short positions, either of which can be negative.
As of October 2026, the US policy rate is 3.88% and Japan's is 1.25%; the full list of central-bank rates is on our rates page. When the currency you hold has the higher rate, the swap before the broker's fee favors the position, and when the gap flips, so does the sign. Broker fees can make both directions negative.
For illustration, assume an annual funding rate of -3.00% on one standard lot of EUR/USD with a notional value of $110,000. The daily charge is $110,000 times 0.03 divided by 365, about $9.04 per night, or roughly 0.9 pip. Spot trades typically settle two business days after the trade date, so the weekend charge is usually applied on Wednesday and is about three times the daily amount. The rate comes from the wholesale market: OANDA, for example, builds its funding rates from its liquidity providers' tom-next swap rates, which price rolling a position forward one day.
The costs add up as follows for one illustrative round trip on one standard lot of EUR/USD:
| Cost item (illustrative) | Pips | Dollars |
|---|---|---|
| Spread of 1.0 pip | 1.0 | $10.00 |
| Commission of $5 round trip (assumed) | 0.5 | $5.00 |
| Slippage of 0.5 pip on the fill (assumed) | 0.5 | $5.00 |
| Total before swap | 2.0 | $20.00 |
| Swap per night at a -3.00% annual funding rate (assumed) | about 0.9 | about $9.04 |
Here the price must move about 2 pips in the position's favor just to cover entry and exit costs, before swap.
Leverage and margin
Leverage lets a position be much larger than the money you set aside for it. That money is margin, a deposit the broker holds against possible losses. Leverage is the position's notional value divided by the margin, so margin is the notional value divided by the leverage: 3.33% at 30:1, 2% at 50:1 and 1% at 100:1. Our margin and leverage post covers the general mechanics, including stock margin accounts.
Four terms describe what happens as the position moves:
- Equity is your account balance plus the open profit or loss.
- Used margin is the deposit set aside for open positions.
- Margin call is a broker warning, or a demand to add money, when equity falls toward the margin requirement. Some brokers send no warning at all.
- Close-out, or stop-out, is the automatic closing of positions when equity falls to a set fraction of the required margin. The FCA's retail rules require it at 50%, and a firm may choose a higher level.
A worked example of 30:1 versus 100:1
Take an illustrative $10,000 account and a 1% adverse move, about 110 pips on EUR/USD at an illustrative 1.1000. The table shows how the loss scales with position size. In the last two rows, the whole account is posted as margin.
| Position size | Notional value | Loss on a 1% adverse move | Loss as a share of the account | Account left |
|---|---|---|---|---|
| 5 times the account | $50,000 | $500 | 5% | $9,500 |
| 30:1, fully used | $300,000 | $3,000 | 30% | $7,000 |
| 100:1, fully used | $1,000,000 | $10,000 | 100% | $0 |
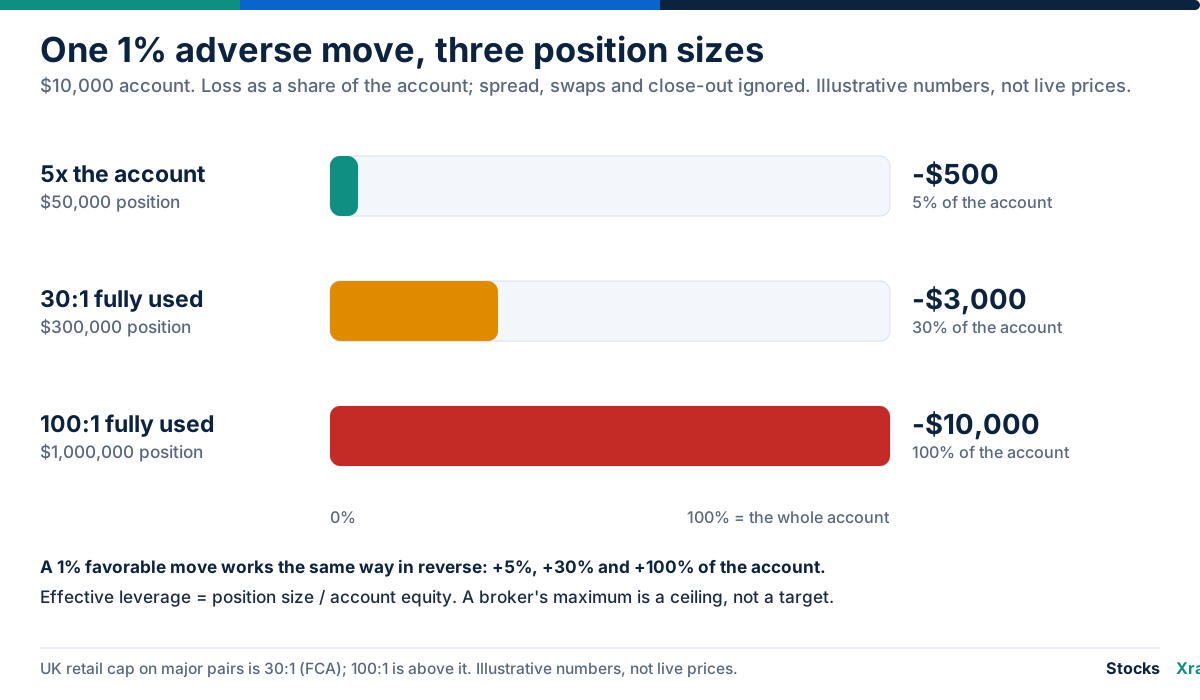
One rule produces the percentages: loss as a share of the account equals position size divided by account size, multiplied by the percent move. The first row shows that leverage is a limit and not a target, because a position of only five times the account faces a much smaller loss under the same move.
The table shows the loss if the position stayed open. A broker with a 50% close-out rule would act sooner: with the whole account posted as margin, equity reaches 50% of the margin requirement after a $5,000 loss. That is a 0.5% adverse move at 100:1, about 55 pips on EUR/USD at 1.1000, and about 1.67%, roughly 183 pips, at 30:1. A price gap can carry the loss past the close-out level, which is why negative balance protection (below) matters.
Gains scale the same way: a favorable 1% move adds 5%, 30% or 100% of the account. Leverage does not change what a pip is worth; position size does, and leverage allows a larger position for the same deposit. The 100:1 row is above the retail cap for major pairs in the UK, the EU and the US. UK and EU rules set no leverage limit for professional clients, and other countries set their own.
Regulation: leverage caps, negative balance protection and risk warnings
Leverage limits for retail clients
Rules for retail clients differ by region. The UK and US figures below were checked against the regulators' own texts in October 2026, and the EU position against an ESMA statement of 24 February 2026.
| Region | Rule | Majors | Other pairs | Losses capped at account funds |
|---|---|---|---|---|
| UK | FCA rules, in force from 1 August 2019 | 30:1 (3.33% margin) | 20:1 for minor pairs and gold (5% margin) | Yes, required |
| EU | National regulators, mirroring ESMA's 2018 measures | 30:1 | 20:1 for non-major pairs, gold and major indices | Yes, part of the measures |
| US | CFTC rule and NFA requirements | 50:1 (2% minimum deposit) | 20:1 (5% minimum deposit) | Not required by these rules; the mandatory risk disclosure warns you may lose more than you deposit |
UK and EU. In 2018 ESMA, the EU securities regulator, adopted temporary product intervention measures on CFDs sold to retail clients. They set leverage limits from 30:1 to 2:1 by the volatility of the underlying, with 30:1 for major currency pairs and 20:1 for non-major pairs, gold and major indices. They also required a 50% margin close-out, negative balance protection, restrictions on trading incentives and a standardized risk warning. The measures were temporary, renewed in three-month steps, and lapsed on 31 July 2019 because national regulators had adopted permanent measures. ESMA's statement of 24 February 2026 confirms that all of them did, mostly mirroring the original decision. The FCA's rules took effect on 1 August 2019. Under them a major pair is any two of the US dollar, euro, Japanese yen, pound sterling, Canadian dollar and Swiss franc, so AUD/USD counts as a minor pair with a 20:1 cap. Retail forex in these markets is generally offered as a CFD or a similar leveraged contract, which is what the rules cover.
United States. The CFTC proposed a flat 10:1 limit in 2010, but its final rules set minimum security deposits of 2% of notional value for major currencies and 5% for others instead. The National Futures Association (NFA) sets the details: Section 12 of its Financial Requirements asks for 2% on ten listed currencies (British pound, Swiss franc, Canadian dollar, Japanese yen, euro, Australian dollar, New Zealand dollar, and the Swedish, Norwegian and Danish currencies) and 5% on other transactions. Pairs of the US dollar with those currencies, such as EUR/USD or AUD/USD, fall in the 2% tier, which implies up to 50:1; the 5% tier implies up to 20:1. These are minimums, which NFA can raise in extraordinary markets and a broker may exceed.
Other countries have their own rules, and some restrict residents' use of offshore forex brokers; the Reserve Bank of India, for example, publishes an Alert List of unauthorized forex platforms. Check which regulator supervises your broker and whether local law permits its use.
Risk warnings and the share of accounts that lose money
Regulators in both regions make providers disclose the loss rate among their own retail clients. In the UK, the FCA rule text requires leveraged contracts for difference, spread bets and leveraged rolling spot forex contracts to carry a standard warning stating what percentage of the provider's retail investor accounts lose money. As an example, OANDA Europe Limited's Risk Warning Disclosures, dated September 2026, say that 76.6% of its retail investor accounts lose money when trading its products. The same document confirms that its retail clients have negative balance protection.
In the US, CFTC rule 17 CFR 5.5(e) requires each forex dealer to disclose, for the last four calendar quarters, the number of its retail forex accounts and the percentages that were profitable and unprofitable. For the quarter ending 30 June 2026, tastyfx, LLC reported 8,801 active non-discretionary retail forex accounts, of which 34.5% were profitable and 65.5% were unprofitable. The profitable share on its page fell in each of the four quarters shown, from 40.84% for the quarter ending 30 September 2025.
These are single-firm figures calculated under different rules and over different periods, so they cannot be added together or read as an industry average. They do show that regulators in both regions want the loss rate in front of every customer.
Volatility: why 20 pips means different things on different pairs
Pips are a good unit for costs and a poor one for comparing risk, because the same number of pips is a different share of the price, and of a typical day, on each pair. Average true range, or ATR, shows this plainly. It is the average price range a market covers in a period, counting any gap from the previous close, so it measures how far a pair usually travels in its own price units. Our ATR post shows how it is calculated.
Annualized volatility gives a quick estimate of a typical day. A common rule of thumb divides the annual figure by about 16, the square root of the roughly 252 trading days in a year. The estimate is crude, but it makes the comparison concrete. The figures below are assumed, not live data.
| EUR/USD (assumed) | GBP/JPY (assumed) | |
|---|---|---|
| Price | 1.1000 | 200.00 |
| Annualized volatility | 8% | 11% |
| Rough typical daily move | about 0.5%, or 55 pips | about 0.7%, or 139 pips |
| 20 pips as a share of price | about 0.18% | about 0.10% |
| 20 pips as a share of a typical day | about 36% | about 14% |
| Pip value, one standard lot, USD account | $10.00 | about $6.67 at a USD/JPY of 150.00 |
Twenty pips is a meaningful move on the first pair and a small one on the second. A stop 20 pips away would be hit far more easily on GBP/JPY, and a 20-pip loss costs $200 on one lot of the first pair and about $133 on one lot of the second. Comparing pairs in pips alone hides all of this.
Here are today's rates for reference, with their annualized volatility. Our forex page shows every tracked pair, and the currency strength page ranks the major currencies. The worked examples do not use these numbers.
| Pair | Latest rate | 1-day change | Annualized volatility |
|---|---|---|---|
| EUR/USD | 1.1237 | +0.2% | 4.6% |
| GBP/USD | 1.3327 | +0.4% | 5.3% |
| USD/JPY | 158.030 | 0.0% | 5.0% |
| USD/CHF | 0.8243 | 0.0% | 6.1% |
| AUD/USD | 0.6950 | +0.5% | 6.8% |
| GBP/JPY | 210.59 | 0.0% | 5.2% |
Rates as of 16 Oct 2026. The chart below shows how EUR/USD has moved over time.
Framing risk as a percent of the account
Because a pip means different things on different pairs, risk is easier to compare as a percent of the account. The arithmetic starts from the loss you would accept and works backward to a size. For illustration, take a $10,000 account, a risk limit of 1% ($100) and a stop 25 pips from entry on EUR/USD, where one standard lot is worth $10 per pip.
Divide the risk by the stop distance times the pip value per lot: $100 divided by (25 pips times $10) is 0.4 lot, or 40,000 units. At that size a pip is worth $4, so a 25-pip loss costs 25 times $4, which is $100, or 1% of the account. The notional value is $44,000 at an illustrative 1.1000, an effective leverage of 4.4 to 1, and margin at 30:1 would be about $1,467. A gap or slippage could make the real loss larger than planned. See position sizing for the general method.
Common mistakes
- Confusing pips with percent. A pip is a fixed step in price units, not a percentage, and one pip is a different fraction of the price on each pair.
- Ignoring the spread and other costs. Spread, commission and slippage can add up to several pips on a short trade, and swap grows with every night a position stays open.
- Treating the leverage limit as a target. The maximum is the largest position allowed, not a sensible size. At full 30:1 use, a 1% adverse move costs 30% of the account.
- Forgetting currency conversion. Pip value is fixed only when the quote currency is the account currency. On yen pairs and crosses it changes with the rate.
- Trading around news without allowing for wider spreads and slippage. Prices can jump past a stop level, and a stop order does not guarantee its fill price.
- Comparing risk across pairs in pips. Percent of account and a volatility measure such as ATR put different pairs on one scale.
Frequently asked questions
How much is a pip worth? It depends on the pair, the position size and the account currency. On a USD-quoted pair such as EUR/USD with a US dollar account, one pip is worth $10 on a standard lot of 100,000 units, $1 on a mini lot and $0.10 on a micro lot. On yen pairs and crosses the value is converted at the current rate, so it changes.
How many pips is 1 percent? It depends on the price. For most pairs, 1% of the price divided by 0.0001 gives the pip count, which is the price multiplied by 100. At an illustrative EUR/USD of 1.1000, 1% is 0.0110, or 110 pips. For yen pairs the pip is 0.01, so 1% of an illustrative USD/JPY at 150.00 is 1.50, or 150 pips.
What is a good spread? There is no fixed benchmark, because spreads vary by pair, broker, account type and time of day. Major pairs usually have the narrowest spreads, and spreads widen in thin or fast markets. The useful comparison is total cost, including any commission, in pips and in dollars per lot.
What is the difference between a pip and a point? A pip is the standard price step for a currency pair: 0.0001 for most pairs and 0.01 for yen pairs. A point has no single meaning. In everyday market talk it is a whole unit of price, such as one index point. On platforms such as MetaTrader and cTrader it is the last digit displayed, which for a five-digit EUR/USD quote is one tenth of a pip.
What is a lot in forex? A lot is a standard trade size in units of the base currency: 100,000 for a standard lot, 10,000 for a mini and 1,000 for a micro, with some brokers also offering nano lots of 100. Brokers differ in the sizes they allow.
How is leverage calculated? Leverage is the notional value of a position divided by the margin posted for it. A $100,000 position held with $3,333 of margin is 30:1, because the margin is 3.33% of the notional value. Effective leverage is notional value divided by account equity, which can be well below the broker's maximum.
What is the maximum leverage in forex? It depends on where the broker is regulated and who the client is. For retail clients the UK and EU cap major currency pairs at 30:1, and US minimum deposits of 2% for major currencies and 5% for others imply 50:1 and 20:1. Professional clients and brokers in other jurisdictions may be offered higher leverage, such as 100:1.
What percentage of forex traders lose money? There is no single official industry figure, because regulators require each provider to publish its own. OANDA Europe Limited's disclosure dated September 2026 states that 76.6% of its retail investor accounts lose money, and tastyfx, LLC reported that 65.5% of its US retail forex accounts were unprofitable in the quarter ending 30 June 2026. The figures are calculated differently and describe each firm's own clients.
Sources and data notes
- BIS, Triennial Central Bank Survey of foreign exchange and OTC derivatives markets in 2025 (30 September 2025): https://www.bis.org/press/p250930.htm
- Bank of England, BIS Triennial Survey 2025, UK data results summary (30 September 2025): https://www.bankofengland.co.uk/-/media/boe/files/statistics/bis-survey/2025/summary-of-uk-survey-results-2025.pdf
- ESMA, final product intervention measures on CFDs and binary options (1 June 2018): https://www.esma.europa.eu/press-news/esma-news/esma-adopts-final-product-intervention-measures-cfds-and-binary-options
- ESMA, decision not to renew its CFD measures (31 July 2019): https://www.esma.europa.eu/press-news/esma-news/esma-ceases-renewal-product-intervention-measures-relating-contracts
- ESMA, public statement on derivatives within the scope of the national product intervention measures on CFDs (24 February 2026): https://www.esma.europa.eu/sites/default/files/2026-02/ESMA35-243228190-8024_-_Public_statement_on_derivatives_in_scope_of_the_CFD_product_intervention_measures.pdf
- FCA, Policy Statement PS19/18, Restricting contract for difference products sold to retail clients (July 2019): https://www.fca.org.uk/publication/policy/ps19-18.pdf
- FCA Handbook, COBS 22.5 and the glossary entry for major foreign exchange pair: https://www.handbook.fca.org.uk/handbook/COBS/22/5.html
- CFTC, Final Rule Regarding Retail Foreign Exchange Transactions, fact sheet: https://cftc.gov/CFTC/PressRoom/PressReleases/forexfinalrulefactsheet
- 17 CFR 5.5 (risk disclosure and account performance disclosure) and 17 CFR 5.9 (security deposits): https://www.law.cornell.edu/cfr/text/17/5.5 and https://www.law.cornell.edu/cfr/text/17/5.9
- NFA Financial Requirements Section 12: https://www.nfa.futures.org/rulebooksql/rules.aspx?Section=7&RuleID=SECTION+12
- OANDA Europe Limited, Risk Warning Disclosures (September 2026): https://legal.oanda.com/oel/risk_disclosure_agreement_uk/en
- tastyfx, LLC, public and risk disclosures: https://www.tastyfx.com/public-and-risk-disclosures/
- OANDA education pages on pips, pip value, lots and financing: https://www.oanda.com/us-en/skills-and-insights/education/introduction-trading/basics/what-is-a-pip/, https://www.oanda.com/us-en/trading/instruments/aud-jpy/ and https://www.oanda.com/us-en/trading/financing-fees/
- OANDA, Points, pips and ticks: https://ftmo.oanda.com/blog/points-pips-and-ticks/
- tastyfx, What is a lot in forex trading: https://www.tastyfx.com/news/what-is-a-lot-in-forex-trading/
- Reserve Bank of India, Alert List of unauthorized forex trading platforms: https://rbidocs.rbi.org.in/rdocs/Content/PDFs/ALERTLIST10022023CC5FC4ACD619431497A56B6894188478.PDF
All worked examples use round, illustrative numbers and are labeled as such. Live rates and volatility come from StocksXray data. Typical spread ranges are not given because no primary source for them was verified, and the leverage and margin rules are those in force as of October 2026, which can change.
Educational information, not financial advice.
Related reading
Educational only, not financial advice. Examples use illustrative numbers.