Purchasing Power Parity (PPP) and the Big Mac Index Explained
Purchasing power parity (PPP) is the idea that, once prices are converted into one currency, the same basket of goods should cost the same in every country. The PPP exchange rate is the rate at which that happens. Market rates rarely match it, so economists use PPP to compare output and living standards, and The Economist's Big Mac index turns it into a lighthearted currency guide. This article explains both, with July 2026 data and honest limits.
Key takeaways
- A PPP exchange rate is a price ratio, not a market price. It is the rate at which a basket costs the same in two countries. Market rates differ from it mainly because many goods and services, such as rent and haircuts, are never traded across borders.
- PPP is a slow anchor, not a timing tool. Rogoff's 1996 survey found that PPP gaps close with a half-life of roughly three to five years, and later work shows those estimates are very imprecise.
- PPP changes the ranking of economies. In the World Bank's 2021 benchmark China, the United States and India were first, second and third at PPP. At market exchange rates India ranked fifth in 2024.
- The Big Mac index is a teaching tool. In July 2026 the US burger cost $6.22 and 41 of 53 other economies were cheaper, yet the World Bank warns that PPP price levels should not be read as measures of currency misvaluation.
- Over decades, inflation gaps show up in exchange rates. From 2000 to 2025 the official Pakistani rupee rate rose about 5.2 times, matching the World Bank's PPP factor, though the path in between was uneven.
What purchasing power parity means
The law of one price
The law of one price says that, once prices are converted to a common currency, an identical good should sell for the same price everywhere. If it did not, traders would buy it where it is cheap and sell it where it is dear until the gap closed. Gold comes close: Rogoff's 1996 review of the evidence cites a February 1995 newspaper listing in which an ounce traded at about $379 in Hong Kong, London, Paris, Frankfurt, Zurich and New York, with the six prices within 55 cents of each other.
Gold is identical everywhere and cheap to ship. Most goods are not: tariffs, shipping, local taxes and local inputs push prices apart, and the same review describes price gaps for similar goods across countries as widespread and volatile.
Absolute and relative PPP
PPP applies the law of one price to whole baskets of goods and services, in two versions.
- Absolute PPP says that national price levels, converted at the market exchange rate, should be equal.
- Relative PPP is weaker and easier to use. It says only that the exchange rate should change by the gap between two countries' inflation rates. If prices rise 10% a year in one country and 2% in another, relative PPP says the first currency should lose about 7.8% a year against the second (1.10 ÷ 1.02 − 1), roughly 2.1 times over 10 years. This is an illustration, not a forecast.
Relative PPP needs only price indexes and exchange rates, so most long-run studies use it. Absolute PPP needs a standard basket priced everywhere, which is why the World Bank runs a global price survey (covered below).
What a PPP exchange rate is, with a worked example
A PPP exchange rate is the rate at which a given basket costs the same in two countries. In its simplest form it is a price ratio: the basket's price in one currency divided by its price in the other. The World Bank publishes a PPP conversion factor for each country, the number of local currency units that buy what one US dollar buys in the United States. The US value is 1 by definition.
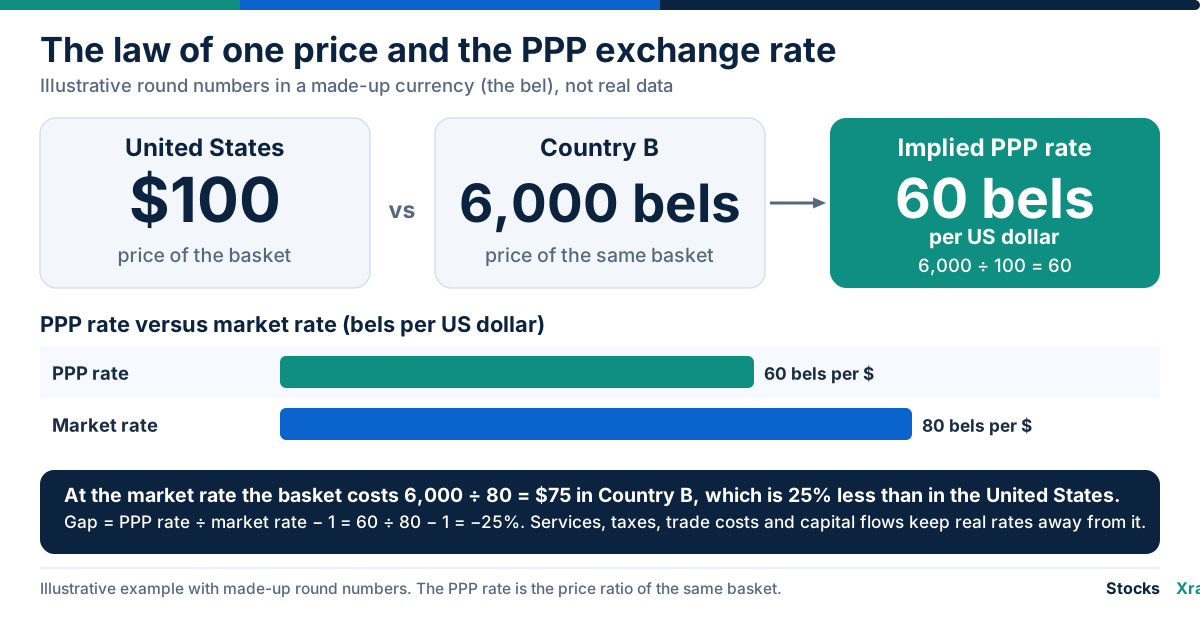
An illustrative example with round numbers in a made-up currency, the bel: a basket costs $100 in the United States and 6,000 bels in Country B.
- PPP rate = 6,000 ÷ 100 = 60 bels per dollar.
- Suppose the market rate is 80 bels per dollar. At that rate the basket costs 6,000 ÷ 80 = $75 in Country B, 25% less than in the United States.
- The PPP rate is 25% below the market rate: 60 ÷ 80 − 1 = −25%. Equivalently, Country B's price level is 75% of the US level.
All this says is that Country B is cheaper than the United States at market rates. It does not say the market rate must move to 60.
Why market exchange rates and PPP rates differ
The Eurostat-OECD methodological manual notes that PPP theory rests on two assumptions: that currency demand and supply come entirely from trade in goods, and that all goods and services can be traded. Neither is true. The table lists the main reasons the two rates drift apart.
| Factor | How it separates prices | Example |
|---|---|---|
| Non-traded goods and services | Local wages, rent and land set the price, and these differ widely | A haircut or restaurant meal costs less where wages are lower |
| Trade costs and barriers | Transport, insurance, tariffs and non-tariff barriers drive a wedge between prices | Rogoff's review cites a crude 1994 estimate of roughly 10% for shipping and insurance |
| Taxes | Sales and value-added taxes sit inside consumer prices and differ by country | The same product carries different tax in different countries |
| Capital flows and speculation | Currencies are traded for investment and speculation, not only to pay for imports | Money moving toward a higher interest rate can lift a currency regardless of price levels |
| Government and central-bank action | Interest-rate decisions, intervention and capital controls move exchange rates directly | A central bank buying or selling its own currency |
| Speed | Exchange rates change every second, while shop prices and wages change slowly | Rogoff's review finds short-run deviations from PPP are large and volatile |
The Balassa-Samuelson idea in plain English
Rich countries have higher price levels than poor ones when everything is converted to dollars at market rates. The standard explanation is the Balassa-Samuelson idea, from two 1964 papers by Bela Balassa and Paul Samuelson:
- Tradable goods such as machinery, phones and wheat face world competition, so they cost roughly the same everywhere.
- Rich countries are far more productive at making tradables, so firms there can pay high wages.
- Those wages spread to the whole economy, including services such as haircuts and teaching, where productivity is hard to raise. Service prices must rise to cover the wages.
- Services cannot be traded, so nothing pulls their prices back down, and the overall price level ends up higher.
The pattern is often called the Penn effect, and the World Bank's 2021 survey shows it. With the world average at 100, the GDP price level index was 136 for high-income economies, 81 for upper-middle-income, 48 for lower-middle-income and 50 for low-income economies. Rogoff's review finds substantial support for the idea, especially when comparing very poor with very rich countries.
So a poor country's currency will look cheap against the dollar on a raw price comparison even when nothing is wrong, which is why the Big Mac index has an income-adjusted version.
How long PPP gaps take to close
Rogoff's 1996 survey in the Journal of Economic Literature found a surprising consensus: deviations from PPP fade with a half-life of roughly three to five years, a damping rate of about 15% a year. A half-life is the time it takes for half of a gap to disappear if no new shocks arrive. In an illustrative case with a four-year half-life, a 20% gap would shrink to about 10% after four years and about 5% after eight.
The same survey stresses the other side: short-run deviations are large and volatile, which Rogoff called the PPP puzzle. Later work by Murray and Papell (2002) found that most point estimates still fall in the three-to-five-year range, but that once confidence intervals are computed the data say little about how long the half-life really is. PPP is a long-run pull on real exchange rates, measured in years rather than weeks.
How PPP is measured and used
The International Comparison Program
PPPs come from price surveys. The World Bank coordinates the International Comparison Program (ICP) under the United Nations Statistical Commission. The program began in 1968, and its 2021 round, the tenth, covered 176 economies and was published in May 2024. Each economy reports prices for a common list of goods and services, and the prices are combined using the share of spending on each group. The Eurostat-OECD program for Europe and other OECD members works the same way, in three stages from single products up to GDP. Three terms matter:
- PPP conversion factor: local currency units per international dollar, a dollar with US purchasing power.
- Price level index (PLI): the PPP divided by the market exchange rate. The ICP scales it so that the world average is 100, and a value above 100 means prices are higher than the world average.
- Extrapolation: between survey rounds the World Bank extends PPPs using relative inflation, so figures after 2021 are estimates until the next round.
The ICP itself describes PPPs as statistical estimates that should be treated as approximations, subject to sampling, measurement and classification errors.
GDP at market rates versus GDP at PPP
Converting GDP at market exchange rates overstates economies with high price levels and understates those with low price levels. PPP conversion corrects this by valuing everything at one set of prices, so it compares volumes of goods and services. The table shows the effect for five economies in 2024, the latest year with a complete cross-section in the World Bank database.
| Economy | GDP at market rates, 2024 | Rank | GDP at PPP, 2024 | Rank | PPP GDP ÷ market GDP |
|---|---|---|---|---|---|
| United States | $29.30 trillion | 1 | $29.30 trillion | 2 | 1.0 |
| China | $18.73 trillion | 2 | $38.24 trillion | 1 | 2.0 |
| Germany | $4.69 trillion | 3 | $6.18 trillion | 6 | 1.3 |
| India | $3.76 trillion | 5 | $15.55 trillion | 3 | 4.1 |
| Pakistan | $0.37 trillion | 43 | $1.57 trillion | 26 | 4.2 |
Source: World Bank World Development Indicators (data last updated 8 October 2026). PPP values after the 2021 benchmark are extrapolated.
India's share of world output is about 3.4% at market rates and 7.8% at PPP, while the US share falls from 26.2% to 14.7%. The ICP's 2021 benchmark shows the same shift by income group: high-income economies produced 63% of world GDP at market exchange rates but 46% at PPP, out of a global total of $152.4 trillion at PPP. Our country pages for India, Pakistan and the United States show GDP in US dollars, and the PPP view here complements them.
Which measure to use depends on the question. PPP suits comparisons of living standards and volumes of output. Market rates suit money flows such as trade, investment and debt payments, because those are settled in actual currency markets, a point the Eurostat-OECD program makes explicitly.
Poverty lines at PPP
The World Bank sets its international poverty line in PPP dollars so that one dollar means the same purchasing power everywhere. Since June 2025 the line is $3.00 per person per day in 2021 PPP terms, replacing $2.15 in 2017 terms, and the Bank estimated about 838 million people lived below it in 2022. Updating the PPP base alone accounts for about $0.35 of the $0.85 rise, and the rest comes mainly from higher national poverty lines in low-income countries.
How the Big Mac index works
The Economist launched the Big Mac index in 1986 as a tongue-in-cheek illustration of PPP and updates it twice a year, in January and July. The burger is a nearly identical product sold in many countries. The magazine presents it as a way to make exchange-rate theory more digestible, not as a precise gauge of currency misalignment.
The three steps
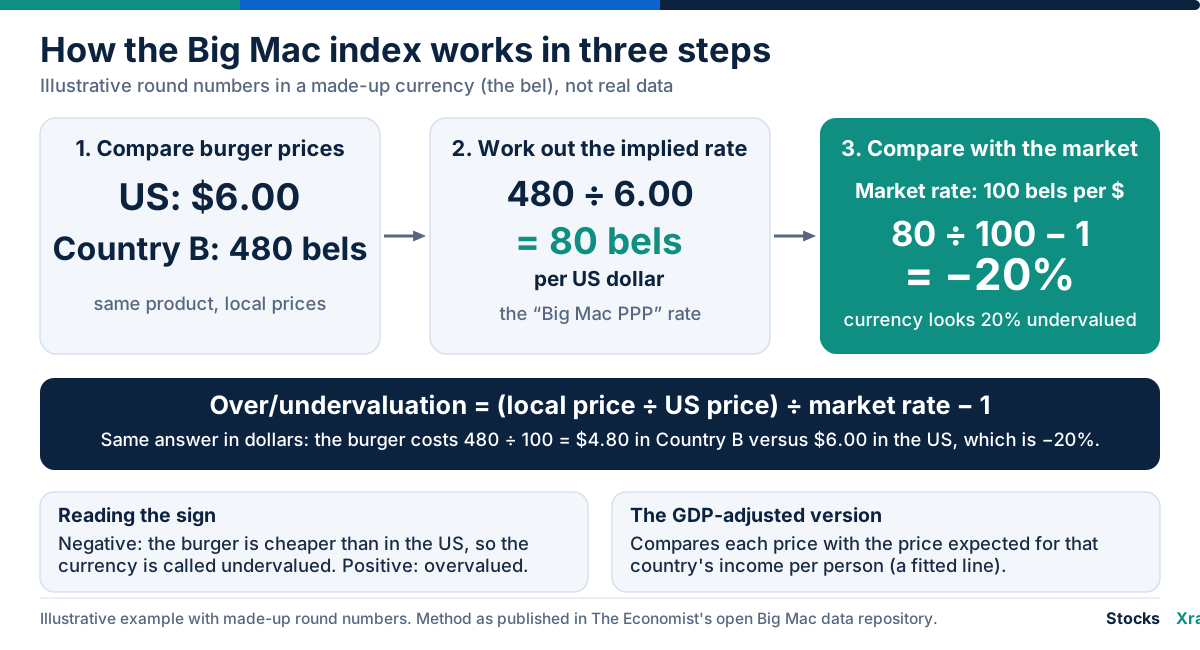
- Take the price of a Big Mac in local currency in each country, and in the United States.
- Divide the local price by the US price. The result is the implied PPP rate.
- Compare it with the market exchange rate. If the implied rate is lower than the market rate, the burger is cheaper than in the US once converted, and the index calls the currency undervalued. If it is higher, the currency is called overvalued.
The formula is: over/undervaluation = (local price ÷ US price) ÷ market rate − 1. The code in The Economist's open repository gets the same result by converting the local burger price to dollars and dividing by the US price.
An illustrative example with round numbers, using Country B again: a Big Mac costs $6.00 in the United States and 480 bels in Country B. The implied rate is 480 ÷ 6.00 = 80 bels per dollar. At a market rate of 100 bels per dollar the burger costs 480 ÷ 100 = $4.80, so the valuation is 80 ÷ 100 − 1 = −20%, and the index would call Country B's currency 20% undervalued. The basket in the earlier example implied a rate of 60 and the burger implies 80: one product is not a basket, and different baskets give different PPP rates.
The GDP-adjusted version
The raw index compares prices only, so poorer countries look undervalued by design, for the Balassa-Samuelson reasons above. The GDP-adjusted version fits a line through burger prices against GDP per person across all countries in the sample, then measures how far each country's actual price sits above or below the price expected for its income. Since July 2022 the US price has come from McDonald's rather than an average of four US cities.
What the July 2026 edition showed
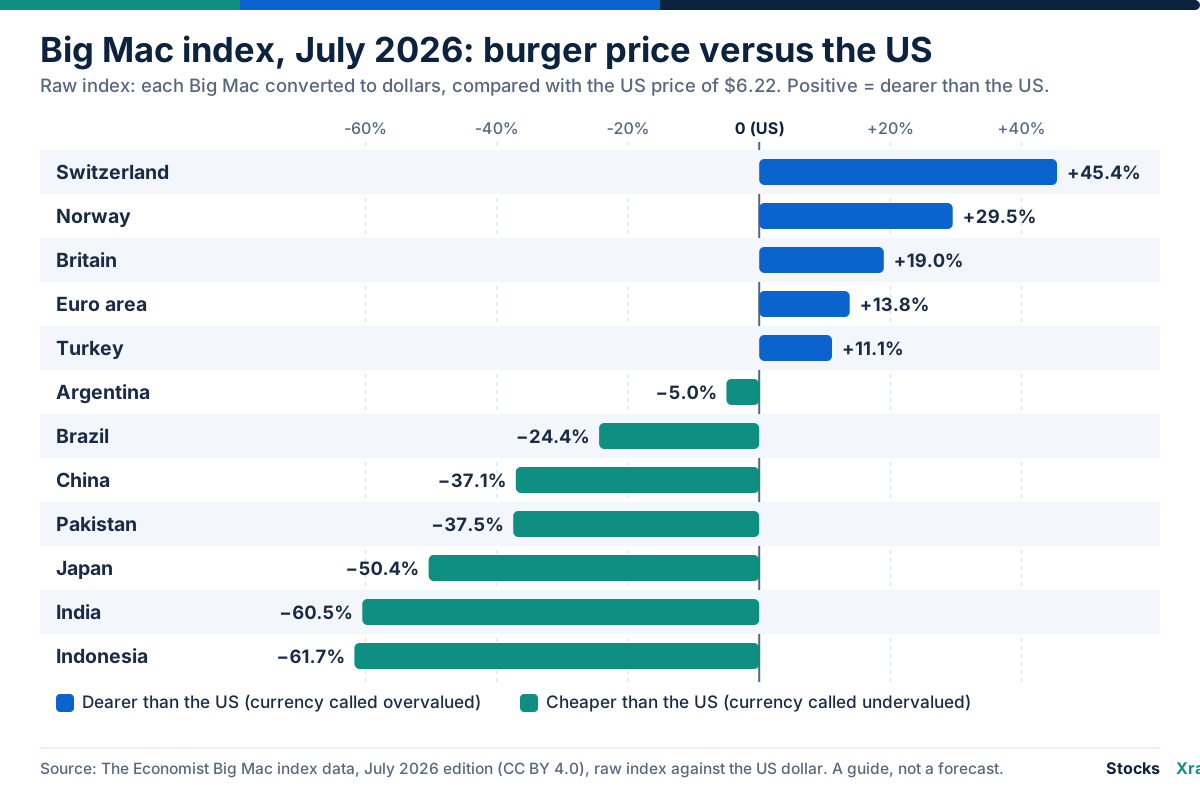
The Economist's open data repository carries the July 2026 edition (last updated 4 August 2026). It covers 53 economies besides the United States, with the euro area counted as one. The US Big Mac cost $6.22.
- Raw index: 41 of the 53 economies had a cheaper burger than the United States and 12 a dearer one. Switzerland was the most expensive at $9.04 (+45.4%). Indonesia was the cheapest at $2.38 (−61.7%), with Taiwan (−61.0%) and India (−60.5%) close behind.
- GDP-adjusted index: 32 of 51 economies sat below the fitted line and 19 above it. Uruguay (+77.4%) and Colombia (+63.6%) were the most overvalued. Taiwan (−61.9%), Indonesia (−51.9%), Hong Kong (−50.1%) and India (−49.5%) were the most undervalued.
- Instability between editions: in January 2025 the adjusted index ranked the Argentine peso the most overvalued of 52 economies (+56.6%). By July 2026 it ranked 14th (+19.0%).
The table shows 12 economies from the July 2026 data. The implied rate is the local burger price divided by $6.22, a calculation we made from The Economist's published prices.
| Economy | Big Mac, local currency | Big Mac in US dollars | Implied rate per US dollar | Raw index vs US | GDP-adjusted index vs US |
|---|---|---|---|---|---|
| Switzerland | CHF 7.30 | $9.04 | 1.17 | +45.4% | +48.5% |
| Norway | NOK 78 | $8.05 | 12.54 | +29.5% | +33.6% |
| Britain | GBP 5.49 | $7.40 | 0.88 | +19.0% | +33.1% |
| Euro area | EUR 6.19 | $7.08 | 1.00 | +13.8% | +29.1% |
| Turkey | TRY 325 | $6.91 | 52.25 | +11.1% | +38.7% |
| Argentina | ARS 8,700 | $5.91 | 1,398.7 | −5.0% | +19.0% |
| Brazil | BRL 23.90 | $4.71 | 3.84 | −24.4% | −6.0% |
| China | CNY 26.50 | $3.91 | 4.26 | −37.1% | −23.8% |
| Pakistan | PKR 1,080 | $3.89 | 173.6 | −37.5% | −19.0% |
| Japan | JPY 500 | $3.08 | 80.4 | −50.4% | −47.2% |
| India | INR 236.25 | $2.45 | 37.98 | −60.5% | −49.5% |
| Indonesia | IDR 43,000 | $2.38 | 6,913 | −61.7% | −51.9% |
Source: The Economist Big Mac index data, July 2026 edition (CC BY 4.0). Dollar prices use the exchange rates The Economist applied for that edition, not today's rates.
The repository's README says the data The Economist generated are available under a Creative Commons Attribution 4.0 licence and the code under the MIT licence, excluding Economist articles and third-party data such as the exchange rates and GDP figures in the files. We show prices and index values with attribution and calculate the implied rates ourselves.
Criticisms and what the research says
- One product. A Big Mac contains traded ingredients such as the beef patty and sauce, but restaurant space and the labor to cook and serve it are essentially local, as Rogoff points out.
- Local costs, pricing and coverage. Rent, wages, taxes and the company's own pricing to local conditions all feed into the shelf price, and income adjustment helps only roughly. The index also covers only places where McDonald's sells.
- Mixed academic verdicts. Pakko and Pollard (Federal Reserve Bank of St. Louis, 2003) found the index performs nearly as well as more comprehensive price comparisons. Clements, Lan and Seah (2012) found a substantial bias but, once corrected, that the index tracks exchange rates reasonably well over the medium to long term. The Eurostat-OECD manual notes that burgernomics is a poor guide to the overall price levels its full survey measures.
What PPP is good for, and what it is not
What it does well. Rogoff observes that few economists take PPP seriously as a short-term proposition, but most believe in some version of it as a long-run anchor for real exchange rates. It is the standard tool for comparing output, incomes, price levels and poverty lines across countries. And relative PPP links exchange-rate drift to inflation gaps, which is why CPI data and inflation trends matter for currencies over long periods.
What it does poorly.
- Timing. With half-lives measured in years and short-run deviations that are large, a gap labeled "undervalued" can persist for a long time. Rogoff shows how fragile such calls are: for Mexico in the early 1990s, the apparent overvaluation of the peso under relative PPP depended heavily on which base year was chosen.
- Verdicts on misvaluation. The ICP states that PPPs should not be used as indicators of currency under- or overvaluation, and the Eurostat-OECD FAQ says a price level index above or below 100 is not the same as a currency being undervalued or overvalued, because PPPs cover many items that are not traded.
- Interest rates and capital flows. In the short run, currencies also respond to interest-rate gaps and money flows, which PPP ignores. Policy rates currently stand at 3.88% in the United States, 5.50% in India and 11.50% in Pakistan. A carry trade, which holds a higher-yielding currency funded by a lower-yielding one, is exposed to exactly these gaps. This post does not cover it, but the rates page and our guide to interest rates and the Federal Reserve show the rate side.
Just as intrinsic value and market price can differ for years for a stock, PPP and market rates can differ for years. The US Dollar Index, published by ICE, measures the dollar against a basket of six currencies: the euro, yen, pound, Canadian dollar, Swedish krona and Swiss franc. On the chart it moves in both directions over the period shown, and over the past year it has changed by +3.1%.
A PPP view cannot say whether the next move on this chart will be large or small. For a live reading of the dollar against other major currencies, see the US Dollar Index page and the currency strength tool. For the wider macro setting, see economic regimes and the Market Compass.
Emerging-market currencies and relative PPP
Relative PPP says a currency with persistently higher inflation than the United States tends to lose value against the dollar over the long run. The World Bank's data let us check this in general terms for four currencies readers often ask about. Between survey rounds the PPP factor is carried forward using relative inflation, and survey rounds reset its level, so it mostly reflects the cumulative price gap with the United States.
| Country | PPP factor, 2000 | PPP factor, 2025 | Rise | Official rate, 2000 | Official rate, 2025 | Rise |
|---|---|---|---|---|---|---|
| Pakistan (rupee) | 12.96 | 67.84 | ×5.2 | 53.65 | 281.14 | ×5.2 |
| India (rupee) | 9.67 | 20.09 | ×2.1 | 44.94 | 87.16 | ×1.9 |
| Turkey (lira) | 0.282 | 16.20 | ×58 | 0.625 | 39.45 | ×63 |
| Argentina (peso) | 0.664 | 567.30 | ×854 | 1.00 | 1,240.85 | ×1,241 |
Source: World Bank WDI, series PA.NUS.PPP (local currency per international dollar) and PA.NUS.FCRF (official rate, local currency per US dollar, annual average). Turkish figures are in the lira introduced in 2005, which the World Bank applies to earlier years.
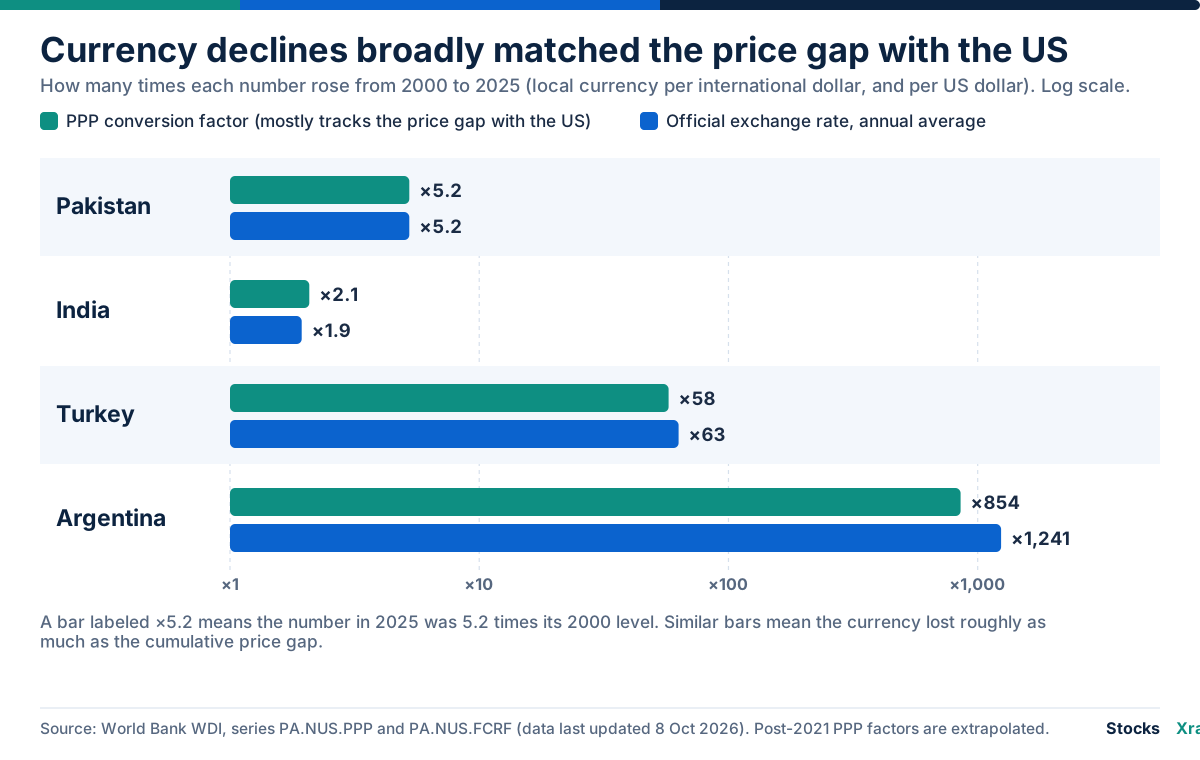
Over 25 years the exchange rates moved by roughly the same multiple as the price gap. Pakistan is the closest match, at about 5.2 times for both. India, with a smaller inflation gap, saw its rate rise about 1.9 times. Turkey and Argentina, with far higher inflation, saw rises of 63 and 1,241 times, although the Argentine peso fell somewhat more than the price gap alone would imply.
The path was not smooth. The ratio of the PPP factor to the exchange rate is the price level relative to the United States: a ratio of 0.25 means a basket costing $100 in the US costs about $25 at market rates. In India and Pakistan the ratio stayed roughly between 0.2 and 0.33 from 2000 to 2025. In Turkey it ranged from about 0.27 to 0.68 and in Argentina from about 0.27 to 0.75, so real exchange rates swung widely around the long-run drift.
High inflation does not always mean a cheaper currency in real terms. Turkey's ratio rose from 0.30 in 2020 to 0.41 in 2025, so local prices climbed faster than the lira fell, which fits the Turkish burger costing 11.1% more than a US one in July 2026. Argentina's ratio moved the other way, from 0.66 in 2000 to 0.46 in 2025.
For the live picture, the charts below show market rates: the Pakistani rupee at 276.74 per dollar (as of 19 Oct 2026) and the Indian rupee at 94.965, with one-year changes of −1.4% and +7.4% (a positive change means the dollar bought more rupees). The Turkish lira's one-year change is +18.0%. These are market facts, not PPP signals.
Each pair has a page with its call, track record and drivers: USD/PKR, USD/INR and USD/TRY. For conversions see the USD to PKR converter and the USD to INR converter, and for all pairs the forex hub. PPP describes the long-run backdrop for these currencies, not where any of them goes next.
Common mistakes
- Reading a Big Mac gap as a forecast. The index compares prices at one date. It does not say a currency will move toward the implied rate, or when.
- Treating "undervalued" as "will rise". With half-lives of three to five years and wide uncertainty around them, a currency can stay cheap by this measure for years.
- Using PPP numbers for money flows. Trade and debt payments settle at market rates.
- Mixing versions and dates. The raw index, the adjusted index and different base currencies give different rankings, and rankings change between editions.
- Forgetting that rich countries are expensive. Because of the Balassa-Samuelson effect, the raw index labels most poor-country currencies undervalued whether or not anything is out of line.
- Copying unsourced numbers. Many sites quote the Big Mac index with stale or mixed data. Check the edition date and base currency.
Frequently asked questions
What is purchasing power parity? Purchasing power parity is the idea that, once prices are converted to one currency, the same basket of goods should cost the same in every country. It is used as a long-run benchmark for exchange rates and to compare output and living standards across countries.
What is a PPP exchange rate and how is it different from the market rate? A PPP exchange rate is the rate at which a given basket costs the same in two countries, found by dividing its price in one currency by its price in the other. The market rate is set every second by trade, investment, interest rates and speculation. The two differ mainly because many goods and services are not traded across borders.
What is the law of one price? The law of one price says an identical, freely traded good should sell for the same price everywhere once converted to a common currency, because traders would otherwise buy where it is cheap and sell where it is dear. It holds closely for gold but weakly for most goods.
Is the Big Mac index accurate? It is a rough guide, not a precise measure. The Economist presents it as a lighthearted teaching tool, and a Big Mac is a single product with many local costs. Research is mixed: a Federal Reserve Bank of St. Louis study found it performs nearly as well as more comprehensive price comparisons, while another found a substantial bias.
What is PPP GDP? PPP GDP is a country's GDP converted into US dollars with PPP conversion factors instead of market exchange rates, so it measures output at one common set of prices. In 2024 India's GDP was about $3.76 trillion at market rates and about $15.55 trillion at PPP, according to the World Bank.
Why does India rank higher on PPP than at market exchange rates? Many goods and services in India cost far less than in the United States. In 2024 the World Bank's PPP conversion factor was about 20.45 rupees per international dollar, against an average market rate of about 83.67, so a basket costs roughly 24% of the US price. Converting at PPP multiplies India's GDP by about 4.1, moving India from fifth to third place.
Which currencies are the most undervalued, and is the US dollar overvalued? No single answer is stable. In The Economist's July 2026 edition the raw index showed the Indonesian rupiah (−61.7%), Taiwan dollar (−61.0%) and Indian rupee (−60.5%) with the cheapest burgers against the US, while the adjusted index put the Taiwan dollar (−61.9%) first. Rankings change by edition, version and base currency, and the ICP and Eurostat warn that PPP price levels are not measures of misvaluation. The US burger was dearer than 41 of 53 other economies and cheaper than 12, including Switzerland and Norway.
How long does it take for a currency to return to PPP? Rogoff's 1996 survey found a consensus half-life of about three to five years for deviations from PPP, meaning half of a gap closes in that time if no new shocks arrive. Later research found those estimates are very imprecise, and short-run deviations are large and volatile, so PPP says little about timing.
Sources and data notes
- Rogoff, K. (1996), "The Purchasing Power Parity Puzzle," Journal of Economic Literature 34(2): https://web.williams.edu/Economics/macro/rogoff.pdf
- Eurostat-OECD Methodological Manual on Purchasing Power Parities, 2012 edition: https://www.oecd.org/content/dam/oecd/en/publications/reports/2012/11/eurostat-oecd-methodological-manual-on-purchasing-power-parities-2012-edition_g1g25be3/9789264189232-en.pdf
- Eurostat, FAQ about Purchasing Power Parities (2012): https://ec.europa.eu/eurostat/documents/728703/728974/FAQ-PPP.pdf
- World Bank, International Comparison Program 2021 Global Highlights: https://thedocs.worldbank.org/en/doc/0274411350395ce53ccd3e91a431e924-0050022024/original/FINAL-ICP-2021-Global-and-regional-highlights.pdf
- World Bank, International Comparison Program: https://www.worldbank.org/en/programs/icp
- World Bank, World Development Indicators API (series NY.GDP.MKTP.CD, NY.GDP.MKTP.PP.CD, PA.NUS.PPP, PA.NUS.FCRF; last updated 8 October 2026): https://api.worldbank.org/v2/sources/2?format=json
- World Bank, June 2025 update to global poverty lines: https://www.worldbank.org/en/news/factsheet/2025/06/05/june-2025-update-to-global-poverty-lines
- IMF, Callen, T. (2007), "PPP Versus the Market: Which Weight Matters?", Finance & Development: https://www.imf.org/external/pubs/ft/fandd/2007/03/basics.htm
- The Economist, Big Mac index data and code (README, licence, July 2026 data): https://github.com/TheEconomist/big-mac-data
- La Nación, report on the July 2026 Big Mac index (4 August 2026): https://www.lanacion.com.ar/economia/indice-big-mac-la-argentina-sigue-entre-los-paises-donde-la-hamburguesa-es-mas-cara-segun-los-nid04082026/
- Pakko, M. and Pollard, P. (2003), "Burgernomics," Federal Reserve Bank of St. Louis Review 85(6): https://ideas.repec.org/a/fip/fedlrv/y2003inovp9-28nv.85no.6.html
- Clements, K., Lan, Y. and Seah, S. P. (2012), "The Big Mac Index two decades on," International Journal of Finance & Economics 17(1): https://doi.org/10.1002/ijfe.432
- Murray, C. and Papell, D. (2002), "The purchasing power parity persistence paradigm," Journal of International Economics 56: https://doi.org/10.1016/S0022-1996(01)00107-6
- ICE, US Dollar Index futures: https://www.ice.com/products/194/us-dollar-index-futures
This article covers the idea, the evidence and the data above. It does not give currency forecasts, trading signals or advice on any currency pair. Live numbers come from StocksXray tokens and charts and change on every page view.
Educational information, not financial advice.
Related reading
Educational only, not financial advice. Examples use illustrative numbers.