Why Currencies Move: Balance of Payments, Interest Rates and Reserves
An exchange rate is the price of one currency in another, and it moves whenever demand for or supply of either currency changes. That demand comes from trade, investment, lending, central banks and speculators. The balance of payments records the first three, and seven forces shape the rest over days, years and decades. This article explains the balance of payments in plain terms, tests each force against dated data, shows how exchange-rate regimes decide who sets the price, and says where the explanations stop working.
Key takeaways
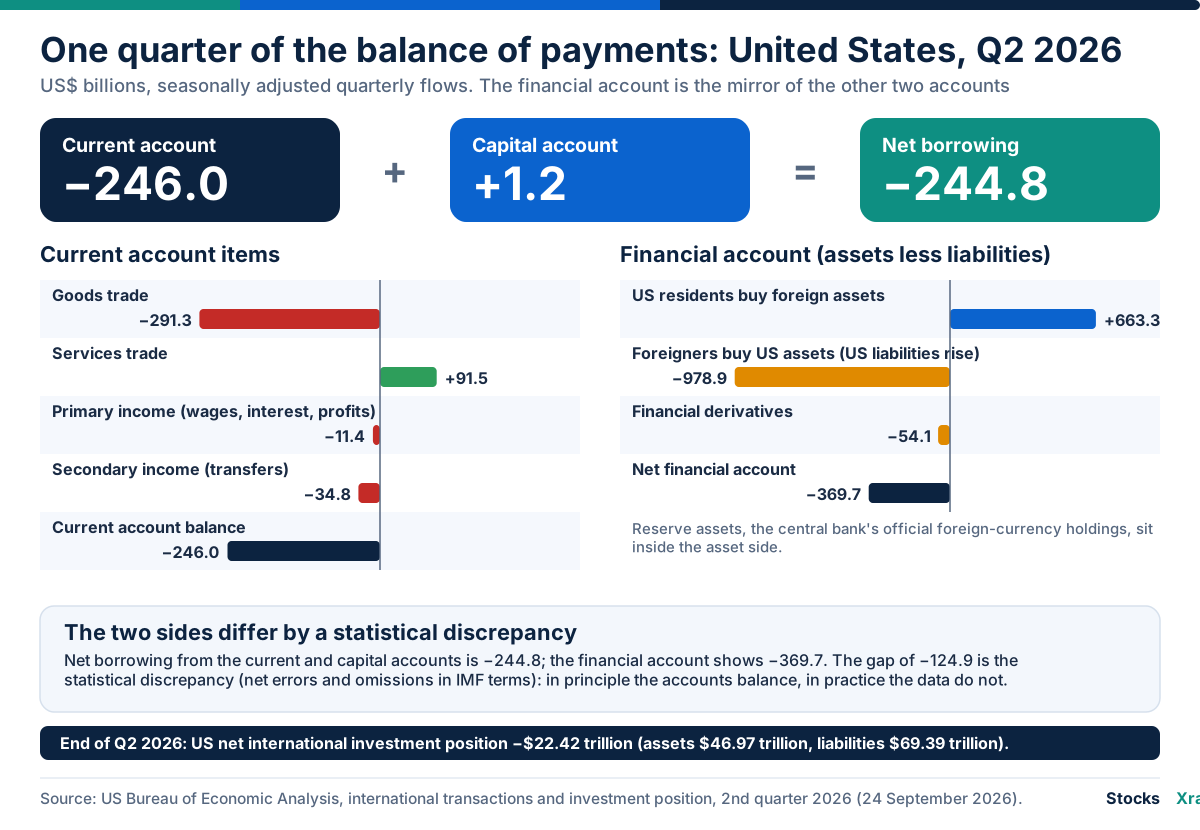
- The balance of payments records every payment between a country and the world, and it balances on paper. The current account plus the capital account equals the financial account, apart from a statistical discrepancy. In the second quarter of 2026 the US current-account deficit was $246.0 billion, the financial account showed net borrowing of $369.7 billion, and the $124.9 billion gap was the discrepancy.
- A deficit or surplus does not point to the currency's direction. In 2022 the US ran a current-account deficit of 3.7% of GDP and the broad dollar index rose 11.4% from the end of 2021 to its September peak. Japan ran a surplus of 2.0% of GDP and the yen lost 23% of its dollar value by 20 October.
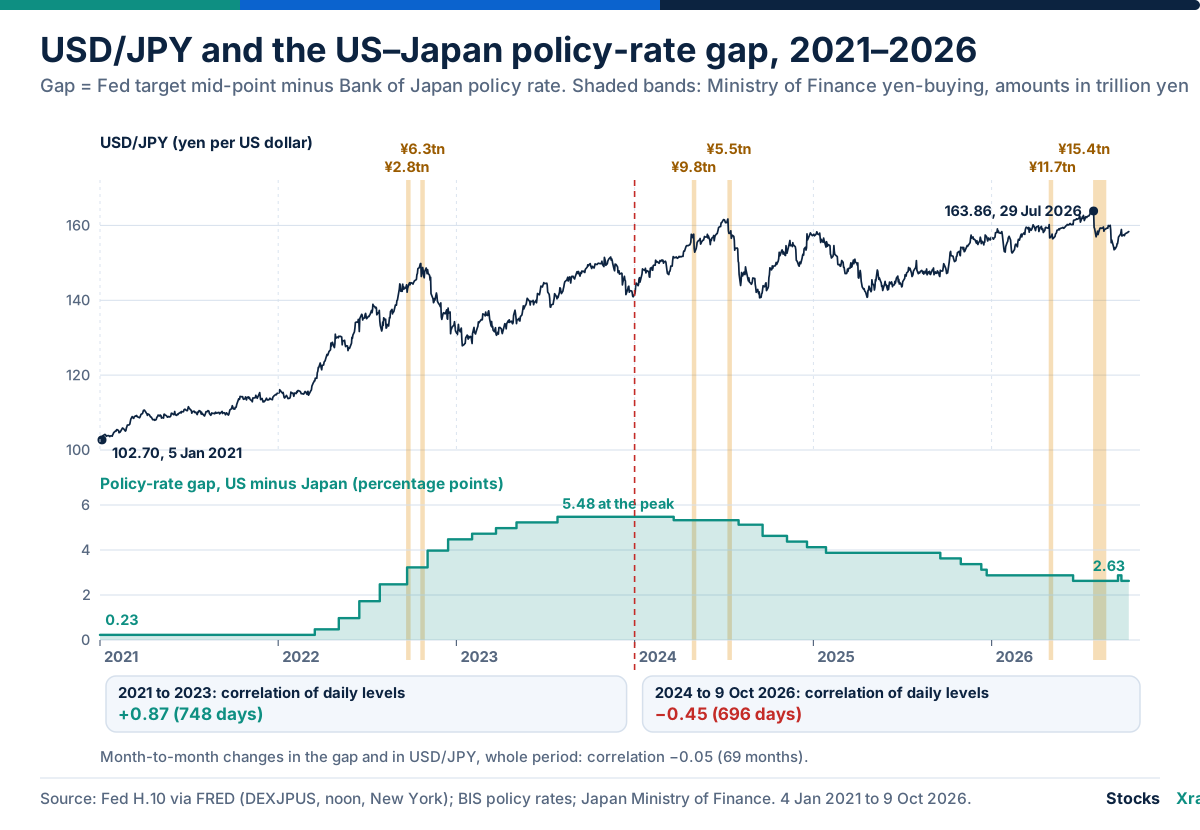
- Each force works on its own clock. The US-Japan policy-rate gap tracked USD/JPY closely from 2021 to 2023 (correlation +0.87 in daily levels) and not afterward (−0.45 from 2024 to 9 October 2026).
- The regime decides who sets the rate. The IMF sorts currencies from free floating to no separate legal tender by what authorities actually do. A deliberate cut in a pegged rate is a devaluation, a market-driven fall under a float is a depreciation.
- Forecasting is the weak point. Meese and Rogoff found in 1983 that a random walk forecast major dollar rates at one to twelve months as well as any model, and a 2013 survey still calls it the toughest benchmark. This article explains drivers and gives no forecasts.
The balance of payments in plain language
The balance of payments (BoP) is a statistical statement of the transactions between a country's residents and the rest of the world over a period, and each transaction is recorded twice. The IMF's Balance of Payments and International Investment Position Manual (BPM6) divides it into three main parts.
- Current account: trade in goods and services, primary income (wages, interest, dividends and profits) and secondary income (transfers such as remittances and aid). Its balance equals the gap between national saving and investment.
- Capital account: capital transfers and purchases or sales of non-produced assets such as land leases and licenses. It is usually small.
- Financial account: net purchases of foreign assets by residents less the net liabilities foreigners take on, covering direct investment, portfolio investment, derivatives, other investment (loans and deposits) and reserve assets.
Reserve assets are foreign-currency assets that the monetary authority controls and can use to meet balance-of-payments financing needs and to intervene in exchange markets. The accounts tie together: the current account plus the capital account is the country's net lending to, or net borrowing from, the world, and the financial account measures the same quantity from the other side. Because source data are imperfect, the two differ by net errors and omissions. The IMF issued a seventh edition, BPM7, in pre-edited form on 20 March 2025 and recommends adoption in 2029 and 2030. The concepts here are those of BPM6.
The United States in the second quarter of 2026 shows the identity with real numbers.
| Item (US$ billions, Q2 2026, seasonally adjusted) | Value |
|---|---|
| Goods trade balance | −291.3 |
| Services trade balance | +91.5 |
| Primary income balance | −11.4 |
| Secondary income balance | −34.8 |
| Current account balance | −246.0 |
| Capital account balance | +1.2 |
| Net borrowing from current and capital accounts | −244.8 |
| Net purchases of foreign assets by US residents | +663.3 |
| Net rise in US liabilities to foreigners | +978.9 |
| Financial derivatives | −54.1 |
| Net financial account | −369.7 |
| Statistical discrepancy | −124.9 |
Foreigners acquired $978.9 billion of US assets while US residents acquired $663.3 billion of foreign ones, so foreign money funded the deficit. At the end of June 2026 the US net international investment position, the stock behind these flows, was −$22.42 trillion, with assets of $46.97 trillion and liabilities of $69.39 trillion.
What a deficit or surplus does and does not imply
A current-account deficit means a country invests more than it saves and borrows the difference, so net capital inflows finance it. Whether that is a problem depends on what the borrowing buys and whether lenders keep lending. It is not a currency forecast. In 2022 the United States ran a deficit of 3.7% of GDP, yet the Federal Reserve's broad dollar index rose from 115.28 on 30 December 2021 to 128.45 on 26 September 2022. Japan ran a surplus of 2.0% of GDP, yet USD/JPY rose from 115.17 to 149.82 on 20 October. Interest-rate gaps and risk flows, covered below, outweighed the current account that year.
A surplus can also mirror investment abroad. Japan's 2022 current account combined a goods-and-services deficit of $157.9 billion with net primary income of $267.6 billion. Under BPM6, reinvested earnings of foreign subsidiaries count as income and are recorded at the same moment as a financing flow in the financial account, so part of that income is by construction already an investment abroad and not a demand for yen. Standard indicators are covered in GDP, CPI, PMI and jobs data.
Seven forces that move exchange rates
Each force below gets one dated example from data a reader can fetch. None works alone.
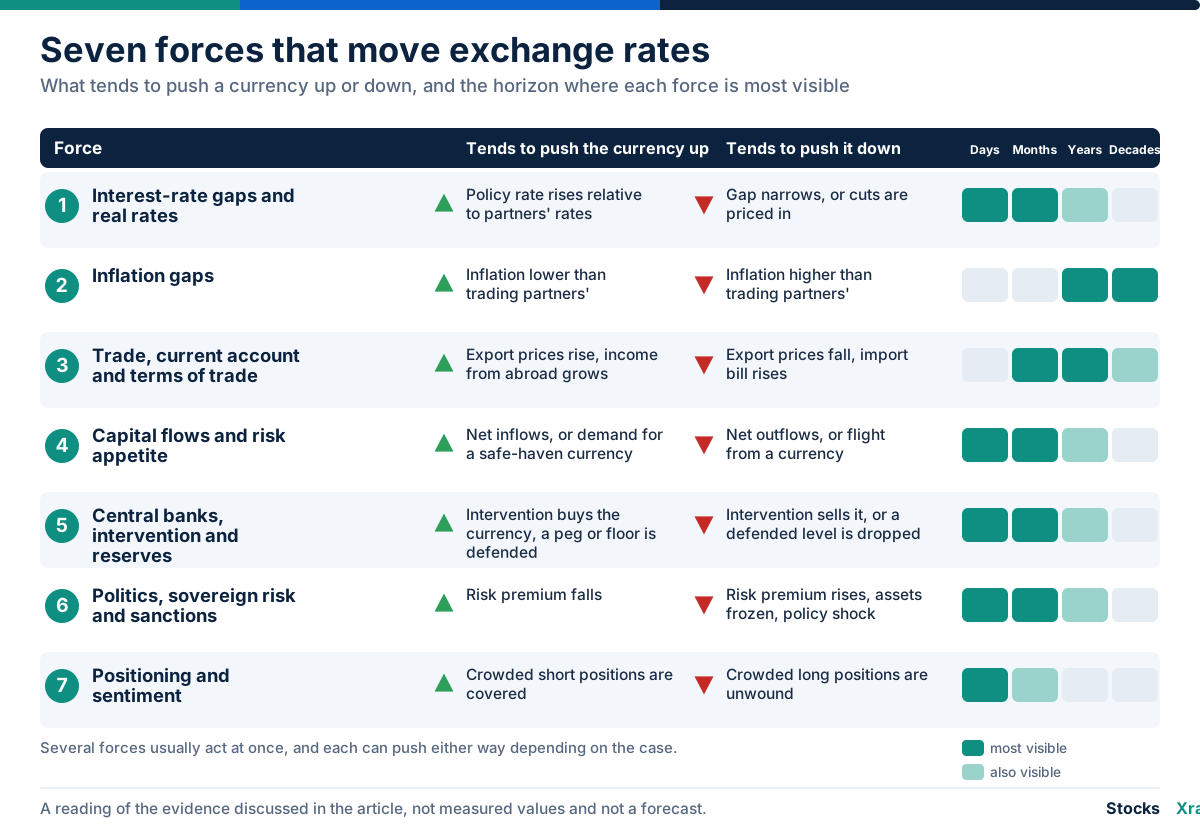
1. Interest-rate gaps and real rates
Money tends to go where it earns more, which suggests that a higher policy rate lifts a currency. Theory states the idea in two forms. Covered interest parity (CIP) says that once currency risk is hedged in the forward market, two currencies offer the same return, so the forward rate offsets the rate gap. The BIS calls it the closest thing to a physical law in international finance, although it has been violated since the 2008 crisis through the cross-currency basis. With an illustrative 4% in the United States and 1% in Japan, the one-year forward USD/JPY would sit about 2.9% below spot (1.01 ÷ 1.04 − 1), which is why a trade that earns the gap unhedged is a bet, as our carry trade guide shows with worked numbers. Uncovered interest parity (UIP) drops the hedge and says the higher-yielding currency is expected to depreciate by the gap.
The evidence on UIP is awkward. In Engel's survey, regressions of currency changes on interest gaps would give a slope of 1 if UIP held, but a long literature finds slopes below 1 and usually below zero: high-rate currencies did not, on average, fall by the gap. Slopes are closer to 1 over ten-year horizons and over very short ones. Real rates, the policy rate minus inflation, matter more to investors than nominal ones. In 2024 US consumer prices rose 2.95% against a year-end policy rate of 4.375%, while Japan's rose 2.74% against 0.25%, so cash in yen earned a negative real return.
The chart below tests the idea on USD/JPY. From January 2021 to December 2023 the US-Japan policy-rate gap widened from 0.23 to 5.48 percentage points, and its correlation with USD/JPY in daily levels was +0.87. From January 2024 to 9 October 2026 the gap narrowed to 2.63 points while USD/JPY reached 163.86 on 29 July 2026 (it was 102.70 on 5 January 2021), and the correlation was −0.45. Month-to-month changes were uncorrelated (−0.05). Correlated levels share a trend and prove no cause. The BIS also noted that after the April 2025 tariff turbulence, widening US-German short-term yield gaps went with a weaker dollar against the euro, the reverse of the usual pattern.
As of October 2026 the US policy rate is 3.88% and Japan's is 1.25% (see the rates page); interest rates and the Fed and bond yields and prices explain how such rates are set and traded. USD/JPY is 158.030 as of 19 Oct 2026.
2. Inflation gaps
If one country's prices rise faster than its partners', its currency tends to lose value over the long run, the idea behind relative purchasing power parity. Our PPP and Big Mac index guide covers it, including the three-to-five-year half-life of gaps, and inflation and stocks covers the price side. The tool is the real exchange rate: the nominal rate adjusted for relative consumer prices. The BIS publishes both for 64 economies as trade-weighted indices.
| Economy | Nominal, Dec 2020 | Nominal, Aug 2026 | Change | Real, Dec 2020 | Real, Aug 2026 | Change |
|---|---|---|---|---|---|---|
| Türkiye | 86.0 | 14.7 | −82.9% | 92.5 | 108.1 | +16.9% |
| Japan | 98.3 | 68.5 | −30.3% | 97.2 | 66.0 | −32.0% |
| India | 96.5 | 80.6 | −16.5% | 98.5 | 90.1 | −8.5% |
| United States | 94.9 | 101.7 | +7.2% | 95.0 | 106.7 | +12.3% |
Source: BIS broad effective exchange rates, 64 economies, 2020 average = 100. Higher means a stronger currency.
Türkiye's currency lost 83% of its nominal trade-weighted value, yet its real index ended 17% higher, because domestic inflation outran the fall. Japan's real index fell slightly more than its nominal one because its inflation was lower than its partners'. India's real fall was about half its nominal fall. Japan's real index reached 65.24 in July 2026, the lowest in the BIS series, which starts in January 1994.
3. Trade, current account and terms of trade
Terms of trade are export prices relative to import prices. For a commodity exporter, a price fall cuts national income and usually demand for its currency. Between 20 June 2014 and 20 January 2016, WTI crude fell from $107.95 to $26.68 a barrel (−75%) while the US dollar rose from 1.0766 to 1.4592 Canadian dollars, a 26% fall in the Canadian dollar's US-dollar value. On 21 January 2015 the Bank of Canada cut its rate to 0.75% because of the oil drop, saying weaker terms of trade would reduce incomes. Its January 2015 report attributed the slide against the US dollar to oil prices and the widespread strength of the US currency, with little change against other partners' currencies.
The link is not mechanical. WTI rose 53%, from $71.13 on 2 March 2026 to $108.64 on 30 April 2026, while USD/CAD went from 1.3705 to 1.3611. Oil importers face the mirror image: fuels are 25.7% of Pakistan's merchandise imports and 2.4% of its exports, according to the World Bank figures on our Pakistan page.
4. Capital flows, risk appetite and safe havens
Currency trading dwarfs the goods trade that the current account records. Foreign-exchange trading was $9.6 trillion a day in April 2025 (BIS), about 100 times the roughly $96 billion a day of world exports of goods and services in 2025 (World Bank), and the US dollar was on one side of 89% of trades. Investors who cut risk tend to buy currencies seen as safe. Ranaldo and Söderlind found for 1993 to 2008 that the Swiss franc and the yen rose against the dollar when US stocks fell and volatility climbed.
The pattern is not fixed. The table shows two risk-off episodes, with windows chosen after the fact to show the contrast.
| Window | Broad dollar index | USD/JPY | USD/CHF |
|---|---|---|---|
| 6 to 20 March 2020 | +7.0% | +5.7% | +5.3% |
| 1 to 21 April 2025 | −3.3% | −5.7% | −8.6% |
Change in the dollar's price; positive means the dollar rose. Source: Federal Reserve H.10 via FRED.
In March 2020 the dollar rose against both havens. On 19 March the Fed set up dollar swap lines with nine more central banks to ease strains in global dollar funding. In April 2025, after US tariff announcements, the dollar fell while the franc and yen rose. The BIS reports that the dollar's usual correlations flipped and that US Treasuries' safe-haven correlations approached zero, and that by mid-2025 the yen had lost ground to the dollar again. A haven is a role a currency plays in a given episode, not a permanent trait.
The US Dollar Index chart shows the swings; its one-year change is +3.1%. Relative moves across the majors are on the currency strength page.
5. Central banks, intervention and reserves
Central banks move currencies through policy rates, through intervention (buying or selling currency) and by defending or abandoning a stated level. Reserves fund intervention. The IMF's COFER survey put official foreign-exchange reserves at $13.22 trillion in the second quarter of 2026, with the US dollar at 56.70%, the euro at 20.60%, the yen at 4.96% and the renminbi at 2.11%.
Japan. The Ministry of Finance publishes every operation, and each period since 2022 was yen buying.
| Period | Amount (¥ trillion) | USD/JPY, day before | USD/JPY, last operation day | USD/JPY, about 1 month later |
|---|---|---|---|---|
| 22 Sep 2022 | 2.84 | 144.14 | 142.16 | 148.76 |
| 21 and 24 Oct 2022 | 6.35 | 149.82 | 148.76 | 139.76 |
| 29 Apr and 1 May 2024 | 9.79 | 157.62 | 157.65 | 157.19 |
| 11 and 12 Jul 2024 | 5.53 | 161.73 | 157.88 | 147.54 |
| 30 Apr to 6 May 2026 | 11.73 | 160.23 | 156.44 | 160.26 |
| 30 Jul to 26 Aug 2026 | 15.40 | 163.86 | 159.36 | 157.18 |
Source: Japan Ministry of Finance; Federal Reserve H.10 noon rates. The last row is the monthly release, so the day before is 29 July and the last day is 26 August.
The rate often moved several yen in a day, then drifted back: it reached 163.86 on 29 July 2026, almost three months after ¥11.7 trillion was spent. Japan's month-end reserves excluding gold fell from $1,257.6 billion in April 2026 to $1,182.2 billion in May, and from $1,177.6 billion in July to $1,083.4 billion in August (IMF data via FRED; valuation changes also move reserves).
Switzerland. On 6 September 2011 the Swiss National Bank set a minimum of CHF 1.20 per euro and said it would buy foreign currency in unlimited quantities; the ECB reference rate for EUR/CHF went from 1.1111 to 1.2036 that day. On 15 January 2015 the SNB discontinued the floor, later saying it could only be held by permanent interventions of rapidly increasing size. The reference rate fell from 1.2010 to 1.0280, a 14.4% drop in one day.
United Kingdom. On 16 September 1992 the Bank of England raised its lending rate to 12%, announced 15% that afternoon, and after heavy intervention failed to lift sterling off its floor in the Exchange Rate Mechanism (ERM), the government suspended membership that evening and rescinded the 15%. The Bank's history page says it was estimated to have cost HM Treasury over £3 billion. GBP/USD went from 1.8715 on 15 September to 1.5625 on 30 October, down 16.5%.
A defended level lasts only while the authority is willing and able to defend it.
6. Politics, sovereign risk and sanctions
Investors demand more return, which shows up as a weaker currency and higher yields, for the risk of default, inflation, capital controls or frozen assets. The UK government announced its Growth Plan on 23 September 2022, and GBP/USD fell from 1.1269 on 22 September to 1.0703 on 26 September (−5.0%). That day the Bank of England's governor referred to the fall in sterling. On 28 September the Bank said dysfunction in long-dated gilts posed a material risk to UK financial stability and began temporary purchases.
Sanctions act more directly. On 28 February 2022 the US Treasury barred US persons from transactions with the Central Bank of Russia, immobilizing its assets in the United States or held by US persons, after allies committed on 26 February to restrict how the bank could deploy its reserves. The same day the Bank of Russia raised its key rate from 9.5% to 20% (BIS series). The ECB reference rate went from 92.57 rubles per euro on 25 February to 115.48 on 28 February (+24.8%), and the ECB suspended the ruble rate after 1 March because it could not set one reflecting market conditions.
7. Positioning and sentiment
Crowded positions in currency futures can add to a move when they unwind. The CFTC's weekly report shows them with a three-day lag, and the research in our COT report guide finds that positions mostly coincide with or follow price rather than predict it. The positioning box on our USD/JPY page places speculators and hedgers on a 0 to 100 scale of their own 104-week range, and the yen COT page shows the futures themselves.
How far the explanations go
Explaining a move afterward is easier than forecasting the next one. Meese and Rogoff (1983) found that a random walk, which predicts that today's rate holds at all future dates, forecast the dollar against the mark, pound and yen, and the trade-weighted dollar, as well as any estimated model at horizons of one to twelve months, even when the models were given the actual future values of their inputs. Rossi's 2013 survey in the Journal of Economic Literature found that predictability depends on the predictor, horizon, sample and method, and calls the random walk without drift the toughest benchmark. Our forecast pages follow that lesson: the range is centered on today's rate and uses past volatility, with no assumed trend.
Exchange-rate regimes and the words for rate changes
Who sets the rate depends on the regime. The IMF classifies each member largely by what its authorities actually do, in three groups plus a residual: hard pegs (no separate legal tender, currency board), soft pegs (conventional peg, stabilized arrangement, crawling peg, crawl-like arrangement, bands) and floating (floating, free floating), with everything else as other managed. The latest edition verified for this article is the 2023 report, posted in December 2024, with classifications as of end-April 2023.
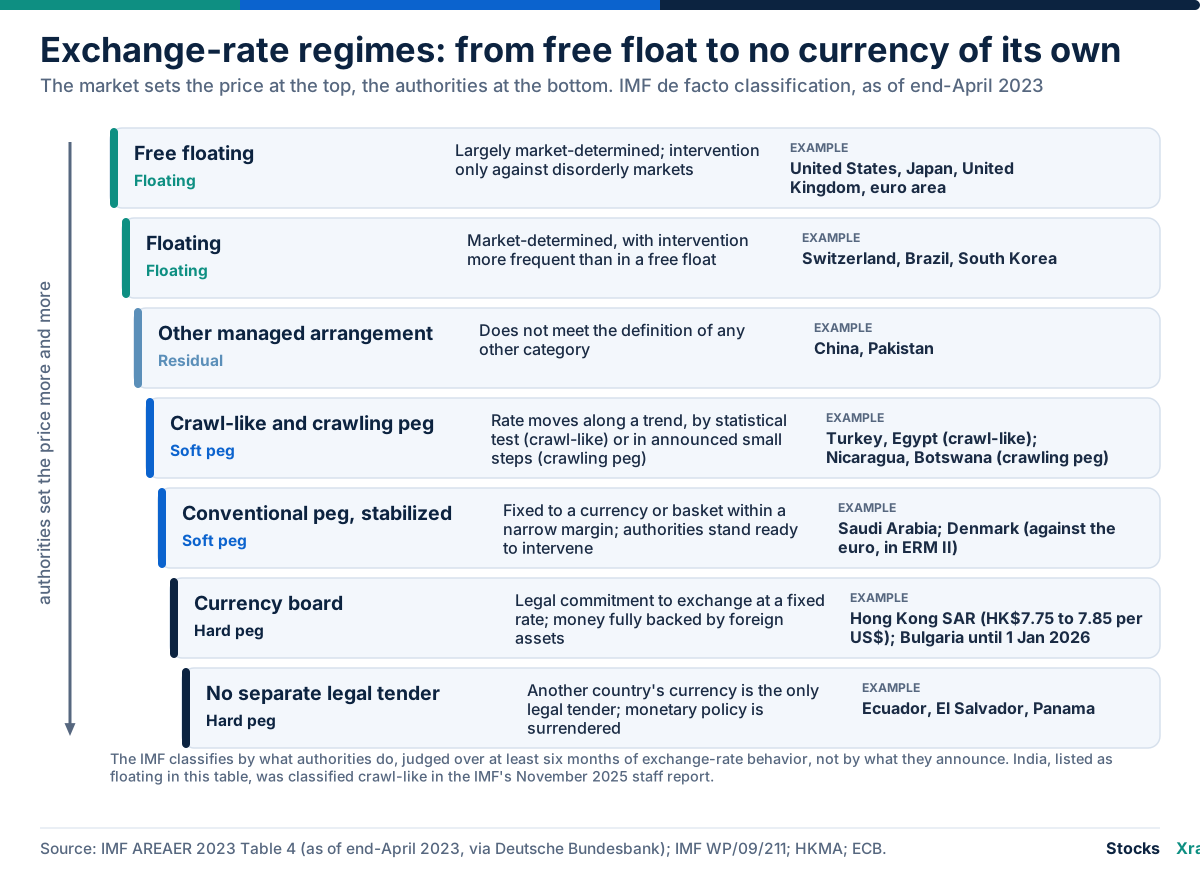
Hong Kong's currency board stands ready to sell Hong Kong dollars at HK$7.75 per US dollar and buy them at 7.85. Denmark keeps the krone around DKK 7.46038 per euro, and Danmarks Nationalbank says the sole purpose of its monetary policy is that stability. Bulgaria's currency board gave way to the euro on 1 January 2026, at a conversion rate of 1.95583 lev per euro. The tighter the peg, the more monetary policy is given up: the IMF says having no separate legal tender implies surrendering monetary control entirely. The classification is statistical and backward-looking, so it changes. India sat in the floating row of the 2023 table, and the IMF's 2025 staff report calls its legal arrangement floating and its actual one crawl-like.
| Term | Meaning | Mostly used for |
|---|---|---|
| Devaluation, revaluation | An official cut or rise in a currency's value | Pegged or managed rates. The lira was devalued within the ERM on 14 September 1992 |
| Depreciation, appreciation | A market-driven fall or rise | Floating rates |
| Nominal exchange rate | The quoted price of one currency in another | Quotes and conversions |
| Real exchange rate | The nominal rate adjusted for relative consumer prices | Competitiveness, long-run comparisons |
Emerging-market currencies: the Pakistani and Indian rupee
Pakistan. The IMF approved a nine-month, SDR 2.25 billion (about $3 billion) Stand-By Arrangement on 12 July 2023 and completed it on 29 April 2024. It approved a 37-month Extended Fund Facility (SDR 5.32 billion) on 25 September 2024 and a 28-month Resilience and Sustainability Facility on 9 May 2025. The board completed the third EFF review on 8 May 2026, and on 7 October 2026 IMF staff reached agreement on the fourth, subject to board approval. IMF figures show gross reserves of $9.8 billion at end-June 2022, $4.5 billion at end-June 2023, $14.5 billion at end-June 2025 and about $21.5 billion by end-September 2026.
The rupee's annual average went from 204.87 per dollar in 2022 to 280.36 in 2023 as consumer inflation reached 30.8%, then 278.58 in 2024 and 281.14 in 2025, with inflation of 12.6% and 3.5% (World Bank). The State Bank held its policy rate at 22% from June 2023 to at least March 2024, cut to 10.5% in December 2025 and raised it to 11.5% on 27 April 2026, its first increase since June 2023. It stands at 11.50% on our rates page. The 2023 IMF table lists Pakistan as other managed, and the IMF's May 2026 report calls exchange-rate flexibility the main shock absorber and says reserve cover remains too low by standard measures.
India. The IMF's 2025 Article IV report (Board discussion on 21 November 2025) classifies India's legal arrangement as floating and its actual one as crawl-like, and says the Reserve Bank intervenes frequently to curb excessive volatility. It records depreciation pressure on the rupee in late 2024 and early 2025, with reserves falling from $706 billion in September 2024 to $668 billion in March 2025 on significant intervention, and net portfolio inflows dropping from 1.2% to 0.1% of GDP in the year to March 2025. The Fed's H.10 series has the rupee at 73.01 per dollar on 31 December 2020 and 96.73 on 9 October 2026. In BIS indices its nominal trade-weighted value fell 16.5% and its real value 8.5% from December 2020 to August 2026.
India's policy repo rate is 5.50% on our rates page, which keeps it by hand because the BIS series for India lags. The two rupees behaved differently, and this article does not credit the gap to one cause: the countries differ in regime, IMF conditions, reserves, inflation and trade structure. Fuels are 28.0% of India's merchandise imports. One dollar buys 276.74 Pakistani rupees as of 19 Oct 2026 (−1.4% over a year) and 94.965 Indian rupees as of 16 Oct 2026 (+7.4%); a positive change means the dollar bought more rupees.
How to see what is moving a currency on our pages
Each page below was loaded on 19 October 2026, and the descriptions cover what it showed.
| Question | Page | What it shows |
|---|---|---|
| Rate gap, drift and positioning for one pair | USD/JPY | A call built from trend, value against a five-year average, carry (the rate gap) and central-bank drift; a box with both policy rates, the gap and six-month drift; CFTC positioning on a 0 to 100 scale; how the pair reacted to US stocks and the US 2-year yield over the past year |
| Which majors are strong or weak | Currency strength | Average move against the other seven majors over 1 day, 1 week, 1 month and 3 months, with a pair-by-pair grid |
| Range of outcomes | USD/JPY forecast | Probability bands centered on today's rate, with a back-test of how often outcomes landed inside them |
| Policy rates | Interest rates | Policy rates for 43 central banks (most from the BIS and the New York Fed, a few checked by hand), with last change and 12-month move |
| Country backdrop | Pakistan, India | Policy rate, inflation, current account and trade as shares of GDP, and the share of fuels in merchandise imports |
| Converting and rate history | USD to PKR | A mid-market daily reference rate, 12-month high and low, the two policy rates, and a note that bank and open-market rates differ |
A simple order of checks is the regime and rate gap, then inflation and trade, then risk appetite and positioning. If currency quotes themselves are new to you, start with what forex is and how the market works. These pages describe; they do not forecast.
Common mistakes
- Reading a deficit or surplus as a forecast. In 2022 the deficit country's currency rose and the surplus country's fell.
- Treating interest parity as a rule. The US-Japan gap tracked USD/JPY in 2021 to 2023 and not afterward, and the BIS saw the usual link break in 2025.
- Calling a currency a safe haven without naming the episode. The dollar rose in March 2020 and fell in April 2025.
- Comparing nominal rates over long periods. Türkiye's nominal index fell 83% while its real index rose 17%.
- Assuming a defended level is safe. Reserves are finite, and both the Swiss floor and sterling's place in the ERM ended within a day.
Frequently asked questions
What is the balance of payments? The balance of payments is a statistical statement of all transactions between a country's residents and the rest of the world in a period. It has a current account (goods, services and income), a capital account (capital transfers) and a financial account (investment, lending and reserve assets). Each transaction is recorded twice, so the accounts balance apart from a statistical discrepancy.
Does a current account deficit weaken a currency? Not by itself. A deficit means foreign capital must fund the gap, and what matters for the exchange rate is whether that funding keeps arriving and at what price. In 2022 the US deficit was 3.7% of GDP while the broad dollar index rose 11.4%, and Japan's surplus of 2.0% of GDP came with a 23% fall in the yen's dollar value.
Why do exchange rates change? They change because demand for and supply of currencies change. The main drivers are interest-rate gaps, inflation gaps, trade and terms of trade, capital flows and risk appetite, central-bank policy and intervention, politics and sanctions, and positioning. Their weight differs by horizon, and no model forecasts the result reliably.
What is the difference between devaluation and depreciation? IMF materials define devaluation as a reduction in a currency's value in terms of foreign currencies, usually an official change to a pegged rate. Under a floating rate a market-driven decline is called depreciation. Revaluation and appreciation are the matching terms for a rise.
What is the difference between a nominal and a real exchange rate? The nominal rate is the quoted price of one currency in another. The real rate adjusts it for relative consumer prices, so it shows competitiveness. From December 2020 to August 2026 the BIS nominal trade-weighted index for Türkiye fell 82.9% while the real index rose 16.9%.
Do higher interest rates strengthen a currency? They can attract capital, but markets price expected rate changes in advance and the evidence is mixed. UIP regressions usually find that high-rate currencies did not fall by the gap, and the US-Japan rate gap tracked USD/JPY in 2021 to 2023 (+0.87) but not from 2024 to October 2026 (−0.45).
What are foreign-exchange reserves and which currencies are they held in? Reserves are foreign-currency assets that a monetary authority controls and can use to meet balance-of-payments financing needs and to intervene in the exchange market. In the IMF's COFER data for the second quarter of 2026, the US dollar made up 56.70% of global foreign-exchange reserves, the euro 20.60%, the yen 4.96% and the renminbi 2.11%.
Can anyone predict exchange rates? Evidence says not reliably. Meese and Rogoff found in 1983 that a random walk forecast major dollar rates at one to twelve months as well as any estimated model, and Rossi's 2013 survey calls it the toughest benchmark. Our forecast pages therefore show probability ranges centered on today's rate.
Sources and data notes
- IMF, Balance of Payments and International Investment Position Manual, sixth edition (BPM6): https://www.imf.org/external/pubs/ft/bop/2007/pdf/bpm6.pdf; BPM7 release, press release 25/072 (20 March 2025): https://www.imf.org/en/news/articles/2025/03/20/pr25072-imf-and-statistical-community-release-new-global-standards-for-macroeconomic-stats
- US Bureau of Economic Analysis, US international transactions and investment position, 2nd quarter 2026 (24 September 2026): https://www.bea.gov/news/2026/us-international-transactions-and-investment-position-2nd-quarter-2026
- World Bank, World Development Indicators API (current account, consumer prices, official exchange rate; updated 8 October 2026): https://api.worldbank.org/v2/sources/2?format=json
- Federal Reserve H.10 foreign exchange rates and broad dollar index via FRED (DEXJPUS, DEXSZUS, DEXUSUK, DEXCAUS, DEXINUS, DTWEXBGS): https://fred.stlouisfed.org/; EIA WTI spot price via FRED (DCOILWTICO)
- BIS central bank policy rates (WS_CBPOL) and effective exchange rates (WS_EER): https://data.bis.org/; BIS Triennial Survey 2025: https://www.bis.org/press/p250930.htm; BIS Quarterly Reviews of September 2016, September 2025 and December 2025: https://www.bis.org/publ/qtrpdf/r_qt1609e.htm and https://www.bis.org/publications/qr-202509/markets-shrug-trade-conflicts
- Engel (2014), Exchange Rates and Interest Parity, NBER Working Paper 19336: https://nber.org/papers/w19336; Meese and Rogoff (1983), NBER chapter: https://www.nber.org/chapters/c11377.pdf; Rossi (2013), Journal of Economic Literature 51(4); Ranaldo and Söderlind (2010), Review of Finance 14(3)
- Japan Ministry of Finance, foreign exchange intervention operations: https://www.mof.go.jp/english/policy/international_policy/reference/feio/index.html
- Swiss National Bank press releases of 6 September 2011 and 15 January 2015 and speech of 24 April 2015: https://www.snb.ch; ECB euro reference rates: https://data.ecb.europa.eu
- Bank of England, Quarterly Bulletin 1992 Q4 and its history page: https://www.bankofengland.co.uk; Bank of Canada, press release and Monetary Policy Report of 21 January 2015: https://www.bankofcanada.ca; US Treasury press release of 28 February 2022 (jy0612)
- IMF, COFER data brief (30 September 2026): https://data.imf.org/en/news/imf%20data%20brief%20september%2030; IMF WP/09/211 on exchange-rate classification; AREAER 2023 Table 4 as reproduced by the Deutsche Bundesbank: https://www.bundesbank.de
- IMF Pakistan documents (country reports 24/105 and 26/101, press releases of 12 July 2023, 8 May 2026 and 7 October 2026) and India Country Report 25/314: https://www.imf.org/en/countries/pak and https://www.imf.org/en/countries/ind
- HKMA, Linked Exchange Rate System: https://www.hkma.gov.hk; Danmarks Nationalbank, fixed exchange rate policy: https://www.nationalbanken.dk; ECB, Bulgaria introduces the euro (1 January 2026): https://www.ecb.europa.eu
This article covers causes and evidence, not forecasts, trading signals or the mechanics of forex trading. Figures are checked as of 19 October 2026, and historical rates use the Federal Reserve's New York noon series, so they can differ from other data vendors' closing prices. Live rates, changes and policy rates come from StocksXray tokens and charts and change on every page view.
Educational information, not financial advice.
Related reading
Educational only, not financial advice. Examples use illustrative numbers.