Carry Trade Explained: How It Works, Payoff and Unwind Risks
A carry trade borrows or sells a currency with a low interest rate and holds one with a higher rate, to earn the difference. The gap is real, and so is the exchange-rate risk: the trade loses money if the higher-rate currency falls by more than the gap. This guide covers the payoff and break-even, why interest parity says the carry is not free, what research finds, and the yen unwind of August 2024.
Key takeaways
- The carry is the rate gap, and exchange-rate risk is its price. In the illustrative example below, a 4-point yearly gap is wiped out if the target currency falls 3.81% over the year. Anything further is a loss.
- Hedging removes the carry. Under covered interest parity the forward rate already contains the rate gap, so the forward rate is the break-even rate. The carry survives only for an investor who stays unhedged.
- Research finds steady gains and sudden losses. Traders say exchange rates "go up by the stairs and down by the elevator." Studies find that carry losses tend to arrive together when volatility jumps, and economists disagree about why.
- A documented unwind: 10 July to 5 August 2024. USD/JPY fell 11.0% in 26 days, and the Nikkei 225 fell 12.4% on 5 August alone. The BIS and the Bank of Japan both link the episode to the unwinding of yen-funded positions, and they differ on the causes.
- A policy-rate gap is only one input. It is not a borrowing cost, a deposit yield or a forecast. The live table below shows today's headline gaps with those limits stated.
What a carry trade is
Every currency position involves two interest rates. Holding a currency earns its deposit or bond rate, and funding the position by borrowing another currency costs that currency's rate. In a carry trade the two are chosen deliberately: the funding currency has a low rate and the target currency a higher one. The difference is the rate gap.
Carry has a general meaning in finance: the return an asset earns if market conditions stay the same. Koijen, Moskowitz, Pedersen and Vrugt use that definition across asset classes. For a currency position, "stay the same" means an unchanged exchange rate, so the carry is the rate gap, and the profit or loss is the carry plus whatever the exchange rate does.
There are three common ways to hold the position.
- Borrow and deposit. Borrow the funding currency, convert it and deposit or invest the target currency. The worked example below does this.
- Forwards and swaps. The BIS notes that carry trades are often built synthetically with forwards, FX swaps and options, which sit off the balance sheet. It also counted yen borrowing by non-banks outside Japan and Japanese retail margin traders in 2024. Some strategies use a low-rate currency to fund bonds or stocks instead, which the BIS calls broader yen-funded strategies.
- A margin account. A retail trader holds a currency pair at a broker, which credits or charges a daily financing amount called swap or rollover. Our pip guide explains how swap is built, why it differs from the central-bank gap and why both directions can be negative.
The payoff formula, with a worked example
Measure everything in the funding currency. A position of size N, held for one year, makes:
Profit = N × [ (1 + target rate) × (1 + exchange-rate change) − (1 + funding rate) ]
The exchange-rate change is the target currency's percent change against the funding currency, positive when the target rises. For small numbers the profit is close to the rate gap plus the exchange-rate change. Setting the profit to zero gives the break-even move:
Break-even change = (1 + funding rate) ÷ (1 + target rate) − 1
It is slightly smaller than the gap, because the fall applies to the principal and the interest together.
An illustrative example
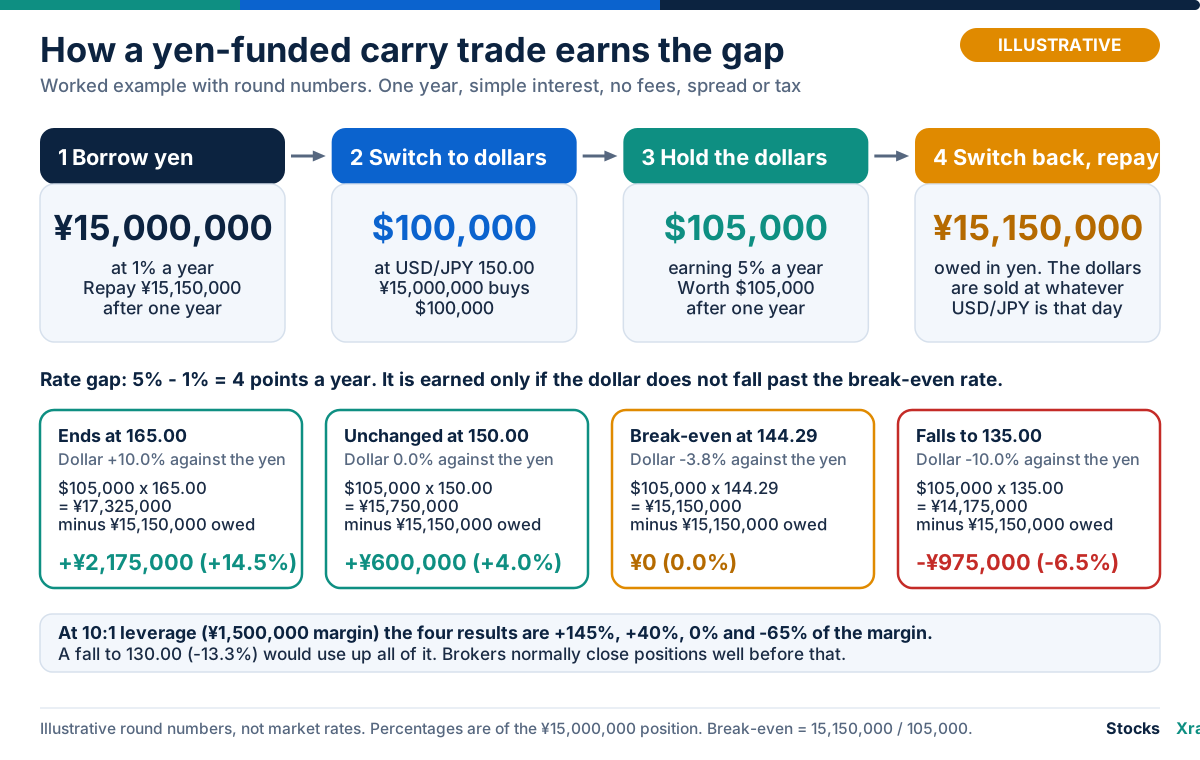
All numbers below are round and illustrative, not market rates. Take a yen funding rate of 1% and a dollar rate of 5%, so the gap is 4 points a year. USD/JPY is 150.00. A trader borrows ¥15,000,000 (worth $100,000), buys dollars and holds them for one year with simple interest and no fees.
- The dollars grow to $105,000. The yen debt grows to ¥15,150,000.
- The break-even rate is 15,150,000 ÷ 105,000 = 144.29, a 3.81% fall in the dollar against the yen.
- At 150.00, the trader sells $105,000 for ¥15,750,000, repays ¥15,150,000 and keeps ¥600,000. That is 4.0% of the position, the full gap.
The table shows five year-end outcomes. The last column repeats them at 10:1 leverage, where the trader posts ¥1,500,000 of margin to control the ¥15,000,000 position.
| Year-end USD/JPY | Dollar vs yen | Profit | As % of position | At 10:1, as % of margin |
|---|---|---|---|---|
| 165.00 | +10.0% | +¥2,175,000 | +14.5% | +145% |
| 150.00 | 0.0% | +¥600,000 | +4.0% | +40% |
| 144.29 | -3.8% | ¥0 | 0.0% | 0% |
| 135.00 | -10.0% | -¥975,000 | -6.5% | -65% |
| 130.00 | -13.3% | -¥1,500,000 | -10.0% | -100% |
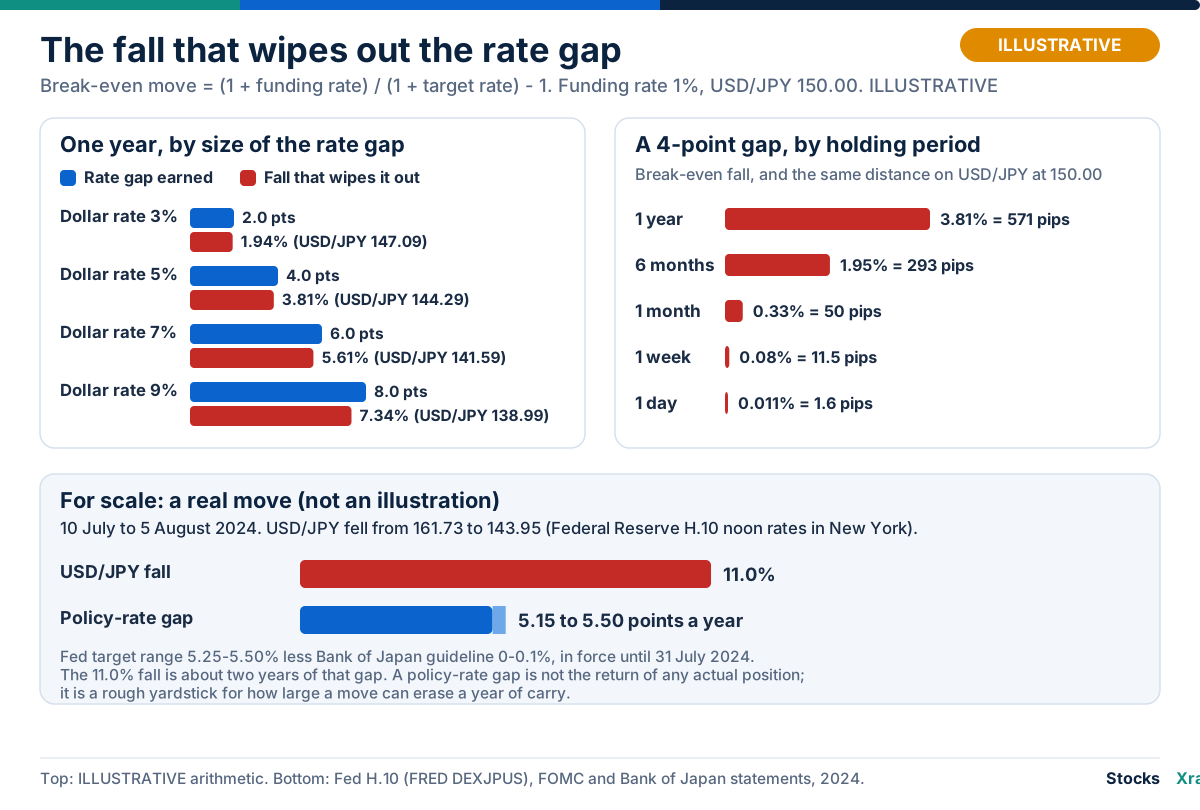
The payoff is lopsided in time as well as in size. A 4-point gap is about 0.011% a day, or 1.6 pips on USD/JPY at 150.00, while the exchange rate can move many times that in a day: USD/JPY's annualized volatility is 5.0% as of 19 Oct 2026, and the pip guide shows how to turn that into a rough daily move. A year of carry arrives slowly, and one bad week can erase it.
Leverage makes the timing worse. A 10% fall in the first days of the trade, before any carry has built up, costs 100% of the margin at 10:1, and brokers close positions long before that. The pip guide describes margin calls and the close-out level the FCA's retail rules set at 50% of required margin, and our margin and leverage guide covers the stock-market version.
Why it is not free money: interest parity
If a rate gap could simply be collected, everyone would borrow the cheap currency without limit. Two parity conditions explain why it cannot be collected without risk. One concerns what you expect to happen, the other what you can lock in today.
Uncovered interest parity: what the theory expects
Uncovered interest parity (UIP) says the high-rate currency should be expected to lose value by about the rate gap, so that holding it earns no more than the low-rate currency on average. Koijen and colleagues note that UIP implies expected price appreciation offsets carry. "Uncovered" means the position is not hedged.
The data do not follow that rule. Burnside, Eichenbaum, Kleshchelski and Rebelo describe the failure as the forward premium puzzle: the currency trading at a forward premium, which is the low-rate one, has tended to lose value. Put the other way round, high-rate currencies have often not fallen by the full gap. Their published abstract reports that carry payoffs were on average large and uncorrelated with traditional risk factors. That describes samples of past data, and it does not promise that the next year pays.
Covered interest parity: what you can lock in today
Covered interest parity (CIP) is the hedged version. The BIS describes it as the interest-rate gap between two currencies in the cash market equaling the gap between the forward and spot exchange rates, because otherwise arbitrageurs could earn a seemingly riskless profit. A forward contract fixes today the rate for exchanging currencies at a future date, and the difference between forward and spot is quoted in forward points.
Use the illustrative numbers: spot 150.00, yen rate 1%, dollar rate 5%.
- Forward rate. One-year forward USD/JPY = 150.00 × 1.01 ÷ 1.05 = 144.29.
- Forward points. 144.29 − 150.00 = −5.71 yen, or −571 pips, because a yen pip is 0.01. The dollar trades at a forward discount of 3.81%.
- The same number twice. 144.29 is also the break-even rate computed earlier.
A trader who sells the $105,000 forward at 144.29 receives exactly ¥15,150,000, the amount owed. The profit is ¥0 whatever the exchange rate does. The hedge removes the risk and the gap together.
| Uncovered interest parity | Covered interest parity | |
|---|---|---|
| What it relates | Rate gap and the expected future exchange rate | Rate gap and today's forward rate |
| Hedged? | No | Yes, with a forward or FX swap |
| Why it holds, or does not | A theory about expectations. In samples studied, it has often failed | An arbitrage condition the BIS calls close to a physical law, yet systematically violated since the 2007-08 crisis |
| What it means for carry | Expected excess return is zero on the theory, but not in the data | The hedged carry is about zero before costs |
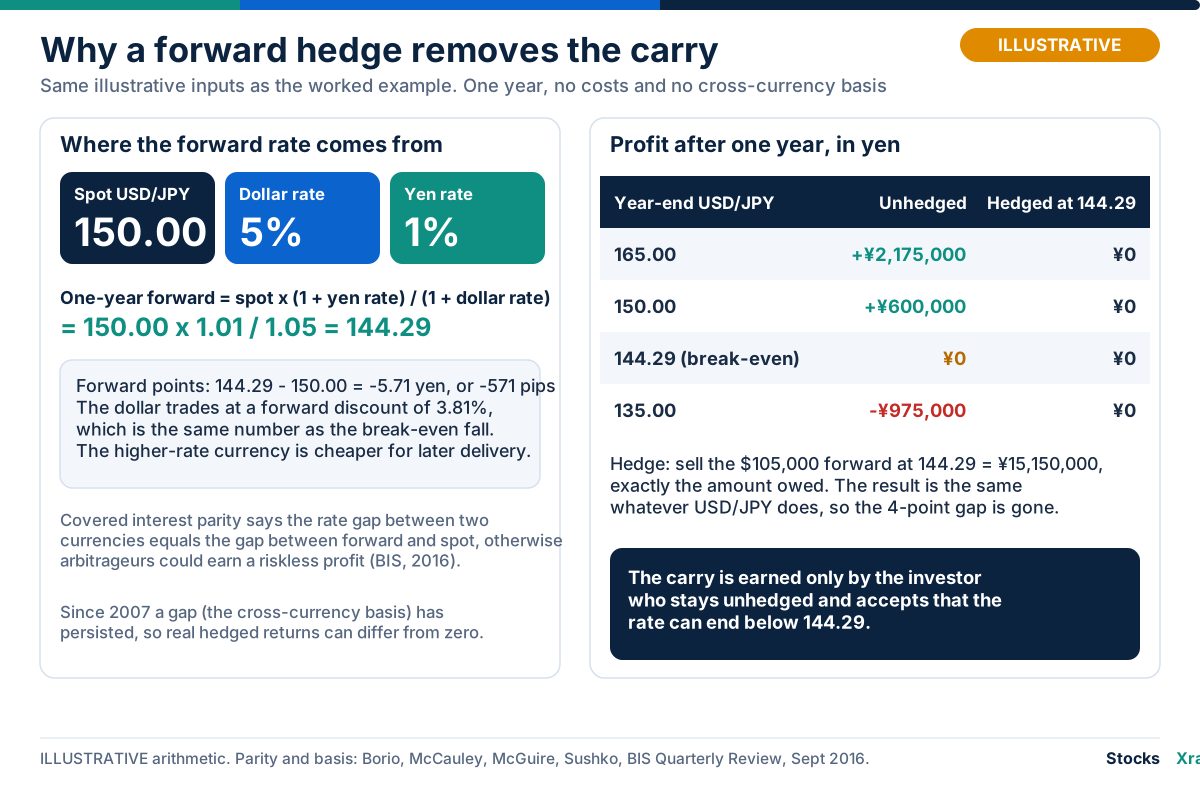
The BIS paper that gives the CIP definition also documents a complication. Since the 2007-08 financial crisis CIP has not held exactly: a cross-currency basis has persisted, and borrowing dollars through the swap market became more expensive than borrowing them directly for most currencies, the yen included. Real hedged returns can therefore differ from zero, and the direction depends on the currency and the period.
So the carry is not a free spread. It is the reward for a bet taken without a hedge, and anyone who covers the exchange-rate risk gives up the carry in the same step. For the long-run link between inflation gaps and exchange rates, see our purchasing power parity guide.
Up the stairs, down the elevator: what research finds
Currency traders have a saying that exchange rates go up by the stairs and down by the elevator. Brunnermeier, Nagel and Pedersen (2008) quote it and test it on eight major currencies against the dollar. The table summarizes what the abstracts of five studies report, in our wording.
| Study | What the abstract reports |
|---|---|
| Brunnermeier, Nagel and Pedersen, "Carry Trades and Currency Crashes" (NBER Macroeconomics Annual, vol. 23) | Exchange-rate moves between high-rate and low-rate currencies are negatively skewed, which means crash risk. The authors attribute it to sudden unwinding of carry trades when risk appetite and funding liquidity fall |
| Burnside, Eichenbaum, Kleshchelski and Rebelo (Review of Financial Studies, 2011) | Carry payoffs were on average large and uncorrelated with traditional risk factors. The authors argue they reflect a peso problem, in which the rare bad event features high values of the stochastic discount factor rather than very large negative payoffs |
| Lustig, Roussanov and Verdelhan (Review of Financial Studies, 2011) | A "slope" factor explains most of the gap in average excess returns between high-rate and low-rate currencies. The working-paper abstract adds that borrowing in low-rate currencies to invest in high-rate ones loads up on global risk, particularly in bad times |
| Menkhoff, Sarno, Schmeling and Schrimpf (Journal of Finance, 2012) | High-rate currencies earn low returns when global FX volatility rises unexpectedly, while low-rate currencies act as a hedge. A volatility risk measure captures more than 90% of the cross-section of excess returns in five carry portfolios |
| Koijen, Moskowitz, Pedersen and Vrugt, "Carry" (Journal of Financial Economics, 2018) | Carry predicts returns across equities, bonds, currencies, commodities, Treasuries, credit and index options. Carry strategies across all those asset classes did poorly in episodes that coincide with global recessions |
Three points follow. Most of the papers describe the same pattern: carry has paid on average in the samples studied, and the bad outcomes cluster in periods of stress, volatility or recession. They disagree about the explanation: crash risk and funding constraints, a global risk factor, volatility risk or, for Burnside and co-authors, a rare bad state with high stochastic discount factor values rather than very large losses. And Brunnermeier, Nagel and Pedersen say the saying holds conditionally: it describes high-rate investment currencies, while the reverse holds for funding currencies. In their sample the yen had the most negative interest differential against the dollar and the highest positive skewness. A funding currency tends to jump up when carry trades unwind.
These are studies of past samples with their own choices of currencies, years and portfolios. None gives a rule for timing, and none shows that any one trade will pay.
The risks of a carry trade
- Crash risk. The reward is small, steady and known in advance. The loss is large, fast and unpredictable in timing, which is the shape the studies above describe.
- A rising funding currency. If the funding currency strengthens, the debt grows relative to the target-currency assets. In the example, a 3.81% fall in the dollar wipes out the gap, which is the same as a 3.96% rise in the yen.
- Margin calls and forced selling. Leveraged positions must be cut when losses mount or lenders raise margins. The BIS reports that during the August 2024 turbulence the Japan Securities Clearing Corporation raised initial margins on long equity-index positions by 60 to 80%. Selling to meet margins pushes prices further the same way, which the BIS calls procyclical deleveraging.
- Links to risk assets and volatility. Brunnermeier, Nagel and Pedersen find that in weeks when the VIX rises, carry trades tend to lose money and speculators cut their carry positions. Our VIX guide explains the index. One shock can hit stocks and carry positions together, which weakens diversification.
- A shrinking or flipped gap. Two central banks set the gap, and either can change it at a meeting. When it narrows the carry shrinks, and a negative gap turns swap from a credit into a charge.
- Costs and the retail gap. A retail trader receives the broker's financing rate, not the policy-rate gap. The pip guide explains the broker's fee, which can make both long and short swaps negative.
- Managed and restricted currencies. Where a central bank limits how freely a currency moves, gaps can be wide and a sudden policy change can break any pattern. Our USD/INR and USD/PKR pages flag both as managed currencies, where carry readings work differently from a free float.
The rate gap today
Policy rates are one of seven forces that move exchange rates; the others, from inflation gaps to intervention, are set out in why currencies move.
A rate gap is the starting point of any carry calculation. The table lists the headline policy rate of five central banks, as of October 2026, from our live central bank rates page.
| Currency | Central bank | Policy rate |
|---|---|---|
| US dollar | Federal Reserve | 3.88% |
| Japanese yen | Bank of Japan | 1.25% |
| British pound | Bank of England | 3.75% |
| Indian rupee | Reserve Bank of India | 5.50% |
| Pakistani rupee | State Bank of Pakistan | 11.50% |
For each pair below, the gap is the rate of the currency held minus the rate of the currency funding it. A negative result means the position would pay more interest than it earns.
| Position (hold, fund) | Gap in percentage points a year | Pair page |
|---|---|---|
| Hold USD, fund in JPY | 3.88% minus 1.25% | USD/JPY |
| Hold GBP, fund in JPY | 3.75% minus 1.25% | GBP/JPY |
| Hold INR, fund in USD | 5.50% minus 3.88% | USD/INR |
| Hold PKR, fund in USD | 11.50% minus 3.88% | USD/PKR |
Read the tables with these limits in mind.
- A policy rate is the headline rate a central bank sets, as our rates page states. It is not what a bank pays on a deposit, what a borrower pays on a loan, or the financing rate a broker applies. The US figure is the middle of the Federal Reserve's target range.
- The gap is one input. It says nothing about exchange-rate moves, volatility, margin or costs.
- Our pair pages flag INR and PKR as managed currencies, where the central bank limits how freely the currency moves, so a large gap tells you less than it appears to. They also quote the gap from the first currency in the pair, so USD/INR and USD/PKR show about the same size as the table with the opposite sign.
For a rough check of the formula, USD/JPY has changed by +2.5% over the past year and GBP/JPY by +3.9% (a positive figure means the first currency bought more yen). The payoff is roughly the gap plus that move, but the gap was different a year ago, so read this as an illustration of the arithmetic, not as a result.
The USD/JPY page and GBP/JPY page show the interest rates behind each pair, the gap in points a year and its six-month drift. Both also show a replay of the model that includes interest earned or paid, and the model's own call, in which carry is one ingredient alongside trend, value and rate drift. This guide does not rely on that call. The USD/JPY page adds CFTC positioning. The USD/JPY forecast and GBP/JPY forecast pages give probability ranges built from past moves at today's volatility. They are not targets, but they show how far a rate could plausibly move, which you can set against the gap. The currency strength page ranks eight major currencies by their average move against the other seven, so you can see whether a funding currency is rising or falling broadly.
A documented unwind: the yen in July and August 2024
The setup
From February 2016 until March 2024 the Bank of Japan applied a negative rate of minus 0.1% to part of banks' reserve balances. On 19 March 2024 it changed its framework, moving away from negative rates, and set its guideline at 0 to 0.1%. The Federal Reserve's target range was 5.25% to 5.50% throughout July. The policy-rate gap between the two countries was therefore 5.15 to 5.50 points a year, and USD/JPY reached 161.73 on 10 July 2024 in the Federal Reserve's H.10 series (the noon buying rate in New York).
The BIS bulletin of 27 August 2024 counted several signs of positioning. Speculative net short positions in yen futures had reached historical peaks of about ¥2 trillion (roughly $14 billion). Its carry-to-risk ratio, the forward-implied rate gap divided by option-implied volatility, peaked in the first quarter of 2024, before Japan began tightening. The Bank of Japan's Financial System Report of October 2024 also records a record net yen short in CME futures data in early July. Our COT guide recomputes the leveraged-funds yen position for those weeks from CFTC data.
What happened
| Date (2024) | Event | Source |
|---|---|---|
| 10 Jul | USD/JPY at 161.73, the high of the year in the H.10 series | Federal Reserve via FRED |
| 24 Jul | Brief equity sell-off with some signs of carry unwinding; the yen rises sharply. USD/JPY falls 1.7% in the day to 153.39, and the VIX closes at 18.04 from 14.72 | BIS; FRED; Cboe |
| 31 Jul | Bank of Japan lifts its guideline from 0 to 0.1% to about 0.25%, by a 7-2 vote, effective 1 August. The Fed keeps its range at 5.25% to 5.50% | Bank of Japan; Federal Reserve |
| 2 Aug | The Nikkei 225 closes 5.8% lower in Tokyo, before the US jobs report is released. The report shows payrolls up 114,000 and unemployment at 4.3%, and the S&P 500 falls 1.8% | FRED; BLS; BIS |
| 5 Aug | Nikkei 225 falls 12.4% to 31,458.42. The S&P 500 falls 3.0%. The USD/JPY noon rate is 143.95. The VIX closes at 38.57 after an intraday high of 65.73 | FRED; BIS; Cboe |
| 6 Aug | Nikkei 225 rises 10.2%. USD/JPY at 145.11 and the VIX at 27.71 | FRED; Cboe |
| 9 Aug | The S&P 500 closes within 0.1% of its 2 August level. The VIX closes at 20.37 | FRED; Cboe |
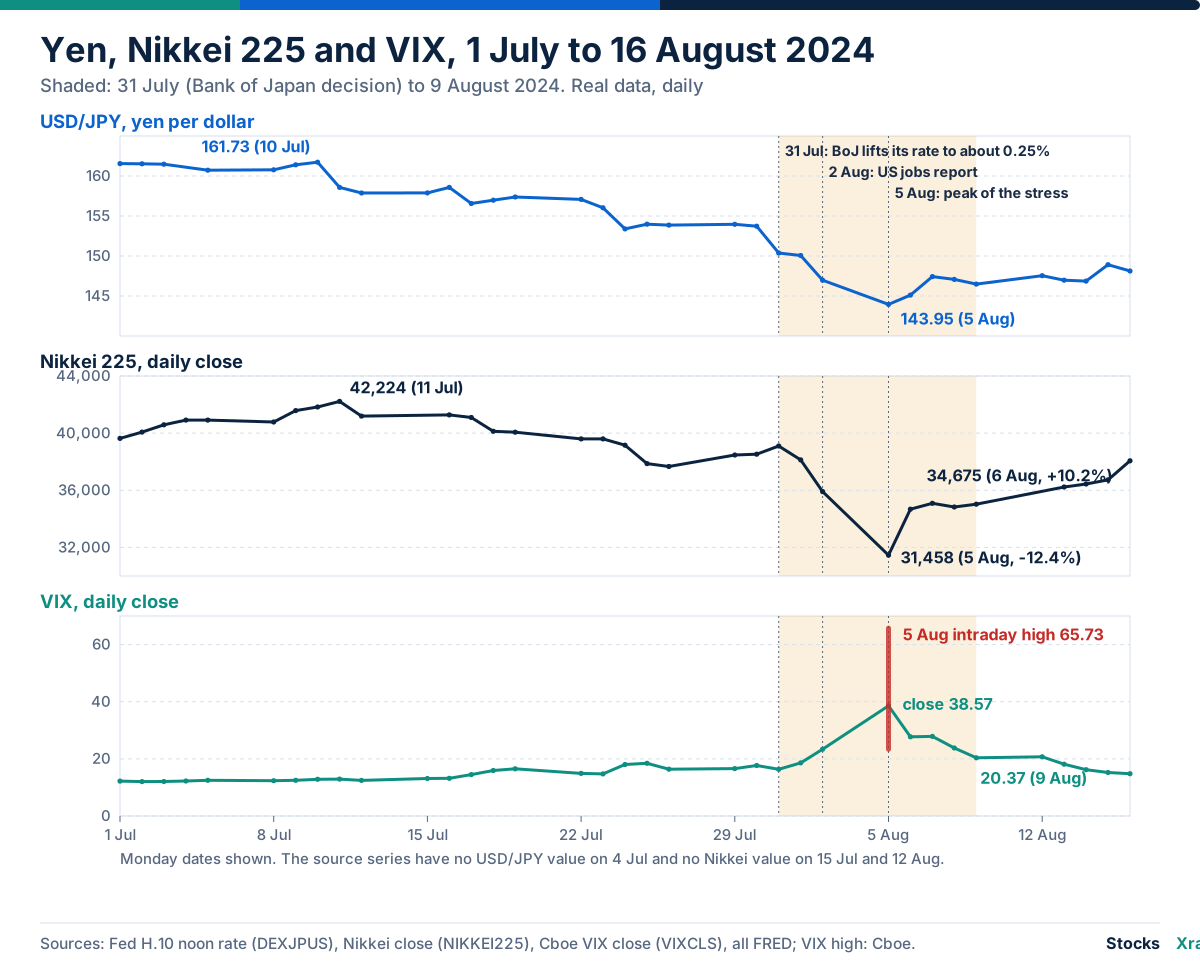
USD/JPY fell 11.0% from 10 July to 5 August, the same move as a 12.4% rise of the yen against the dollar. The H.10 series is a New York noon rate, so it misses the extremes inside a day. The fall is about twice the policy-rate gap above, and on 5 August the Nikkei closed 25.5% below its 11 July close of 42,224.02.
What the official analyses say
The BIS bulletin describes a leveraged unwind in equity and currency markets in which yen-funded carry trades were hit hardest. In its account, a hawkish-seeming Bank of Japan rate rise, a more cautious approach to rate cuts at the Federal Reserve and a disappointing US labor market release on 2 August were the triggers. Markets were hypersensitive, and deleveraging and margin increases amplified the move. Over 1 to 5 August the yen rose the most against the dollar, followed by the Swiss franc, another popular funding currency, while among high-yielding currencies the Mexican peso fell the most, followed by the Brazilian real and the South African rand.
The BIS gave a rough middle estimate of ¥40 trillion ($250 billion) for carry trades going into the event and said it is probably biased down by data gaps. It also made a point that is easy to miss: the exchange-rate moves were not outsized compared with past well-known carry crashes, and FX volatility rose far less than equity volatility. By 9 August the S&P 500 had recovered the 3.0% fall of 5 August, and the VIX had fallen back.
The Bank of Japan's report puts the weight differently. It attributes the early-August turbulence mainly to the unwinding of accumulated positions after concern about a US slowdown grew. It says yen carry positions were unwound partly because the dollar weakened globally and partly because of the Bank's July policy change. For Japanese stocks it adds follow-on selling by foreign investors and loss-cutting by margin traders at home.
The causes remain debated. The two reports agree that carry positions unwound and that leverage and margin amplified the move. They differ in emphasis between US growth fears, the Bank of Japan's decision and the leverage built up beforehand. Neither report gives a single cause, and neither does this guide.
What the episode shows
Two things are visible in the data. First, the move was far larger than the carry it erased: an 11.0% fall in 26 days against a policy-rate gap of about 5 points for a whole year. Second, the drop followed a calm spell: from 3 June to 10 July the VIX closed between 11.94 and 13.33, while USD/JPY rose from 156.04 to 161.73. The BIS says that kind of prolonged, low-volatility risk-taking encouraged the leveraged positions that amplified the move.
It is a documented example of unwind risk, not a template. It does not show when the next one will come, and the BIS added that the factors behind the volatility spike had not changed much and that some leveraged positions were already being rebuilt.
Carry in other markets
Carry exists wherever an asset earns something while its price stands still, and Koijen and colleagues find that it predicts returns in equities, bonds, commodities and other markets, with bond carry closely related to the slope of the yield curve and commodity carry to the convenience yield. In commodity futures it shows up as contango and backwardation, explained with a roll example in our commodity prices guide, and in bonds as the slope of the US Treasury yield curve.
Common mistakes
- Treating the rate gap as the profit. The gap is the carry only if the exchange rate does not move. The result is the gap plus the move, and the move is usually larger.
- Using policy rates as borrowing and deposit rates. Headline rates guide the gap, but the rates a trader actually receives and pays, including broker financing, differ.
- Ignoring leverage and the path. A margin call can end the trade in a week even if the exchange rate recovers in a month.
- Believing a hedge keeps the carry. A forward already prices the rate gap in, so a fully hedged carry trade earns about the funding rate.
- Reading calm as safety. The BIS found that the long low-volatility period before August 2024 encouraged the leverage that amplified the move.
- Treating one episode as a pattern for timing. The 2024 unwind is documented history. Nothing in it says when the next one comes or how large it will be.
Frequently asked questions
What is a carry trade? A carry trade borrows or sells a currency with a low interest rate, the funding currency, and holds a currency with a higher rate, the target currency, to earn the difference. The result is the rate gap plus or minus the change in the exchange rate. It works only while the exchange rate does not move against the position by more than the gap.
Is a carry trade risky? Yes. The gap accrues slowly, a day at a time, while the exchange rate can move far more in a day, and leverage multiplies both. Research documents negative skewness: carry losses tend to arrive together when volatility jumps and funding tightens. In the illustrative example, a 3.81% fall in the target currency erases a full year of a 4-point gap.
Why is the yen a funding currency? The yen carry trade is a carry trade funded in yen, and the yen is the usual funding currency because Japan's policy rate has been at or near zero for years. The Bank of Japan applied a negative rate to part of bank reserves from 2016 until March 2024, and in July 2024 it raised its guideline only to about 0.25%, against a US range of 5.25% to 5.50%. The BIS calls the yen the predominant carry-trade funding currency and the Swiss franc another popular one. The gap has narrowed as the Bank of Japan has raised rates, and its policy rate is now 1.25%.
What is a carry trade unwind? An unwind is the closing of many carry positions at about the same time. It tends to start when the funding currency rises, volatility jumps or lenders raise margins, and the selling of the target currency and buying back of the funding currency pushes the funding currency higher still. The BIS described early August 2024 as a leveraged unwind in equity and currency markets in which yen-funded carry trades were hit hardest.
How does the interest-rate gap affect currencies? A wider gap makes the higher-rate currency more attractive to hold, but interest parity says it should be expected to lose value by about the gap, so the effect is not one-directional. In past data, high-rate currencies have often not fallen by the full gap, yet they have been vulnerable to sharp reversals. Changes in the expected gap matter too: the Bank of Japan's July 2024 rate rise narrowed the gap, and both the BIS and the Bank of Japan list it among the factors behind the yen's rise. See also our guide to interest rates, the Federal Reserve and stock prices.
Does hedging remove carry? Yes, in principle. A forward contract fixes the exchange rate in advance, and that forward rate already reflects the interest gap, so a hedged position earns about the funding currency's rate. This is covered interest parity. Trading costs and the cross-currency basis, which has persisted since 2007, mean the hedged return can differ from the funding rate.
How do you calculate carry trade profit and break-even? Profit equals the position size times (1 + target rate) × (1 + exchange-rate change) − (1 + funding rate), which is roughly the rate gap plus the exchange-rate change. The break-even change is (1 + funding rate) ÷ (1 + target rate) − 1. With a 1% funding rate and a 5% target rate it is −3.81% over a year. Fees, margin and the broker's financing rate move the real figure.
Sources and data notes
- Bank for International Settlements, BIS Bulletin No 90, "The market turbulence and carry trade unwind of August 2024" (27 August 2024): https://www.bis.org/publ/bisbull90.htm
- Bank of Japan, statements of 29 January 2016, 19 March 2024 and 31 July 2024: https://www.boj.or.jp/en/mopo/mpmdeci/mpr_2016/k160129a.pdf, https://www.boj.or.jp/en/mopo/mpmdeci/mpr_2024/k240319a.pdf and https://www.boj.or.jp/en/mopo/mpmdeci/mpr_2024/k240731a.pdf; Financial System Report, October 2024, Box 1: https://www.boj.or.jp/en/research/brp/fsr/data/fsr241024a.pdf
- Federal Reserve, FOMC statement of 31 July 2024: https://www.federalreserve.gov/newsevents/pressreleases/monetary20240731a.htm
- US Bureau of Labor Statistics, Employment Situation for July 2024: https://www.bls.gov/news.release/archives/empsit_08022024.htm
- FRED series DEXJPUS (Federal Reserve H.10), NIKKEI225 (Nikkei Inc.), VIXCLS (Cboe) and SP500: https://fred.stlouisfed.org/series/DEXJPUS, https://fred.stlouisfed.org/series/NIKKEI225, https://fred.stlouisfed.org/series/VIXCLS and https://fred.stlouisfed.org/series/SP500
- Cboe, VIX historical data (open, high, low, close): https://cdn.cboe.com/api/global/us_indices/daily_prices/VIX_History.csv
- Borio, McCauley, McGuire and Sushko, "Covered interest parity lost: understanding the cross-currency basis," BIS Quarterly Review, September 2016: https://www.bis.org/publ/qtrpdf/r_qt1609e.htm
- Brunnermeier, Nagel and Pedersen, "Carry Trades and Currency Crashes," NBER Working Paper 14473: https://www.nber.org/papers/w14473
- Burnside, Eichenbaum, Kleshchelski and Rebelo, "Do Peso Problems Explain the Returns to the Carry Trade?", Review of Financial Studies 24(3), 2011: https://doi.org/10.1093/rfs/hhq138
- Lustig, Roussanov and Verdelhan, "Common Risk Factors in Currency Markets," NBER Working Paper 14082: https://www.nber.org/papers/w14082
- Menkhoff, Sarno, Schmeling and Schrimpf, "Carry Trades and Global Foreign Exchange Volatility," Journal of Finance 67(2), 2012: https://doi.org/10.1111/j.1540-6261.2012.01728.x
- Koijen, Moskowitz, Pedersen and Vrugt, "Carry," Journal of Financial Economics 127(2), 2018: https://www.nber.org/papers/w19325
- StocksXray pages used for rates and pair descriptions: https://stocksxray.com/rates, https://stocksxray.com/forex/usd-jpy, https://stocksxray.com/forex/gbp-jpy, https://stocksxray.com/forex/currency-strength
All worked examples use round, illustrative numbers and say so. Live rates and price changes come from StocksXray tokens and charts and change on every page view. Covered: the currency carry trade, its arithmetic, parity conditions, the research above and one documented episode. Not covered: any forecast or ranking of currency pairs, tax, a retail broker's own financing terms, and the size of any market's carry positions today.
Educational information, not financial advice.
Related reading
Educational only, not financial advice. Examples use illustrative numbers.